Smart Energy Meters are the next evolution in household and industrial power monitoring systems. Unlike traditional meters that only measure consumption, smart meters provide real-time data on voltage, current, power, and energy usage—helping users track performance, identify inefficiencies, and control connected appliances intelligently.
With the integration of IoT (Internet of Things), these meters can now transmit data over Wi-Fi, enabling seamless remote monitoring, automated alerts, and smart control from anywhere in the world. Whether you’re a hobbyist, engineer, or homeowner, such systems empower you to better manage electricity consumption and protect your devices from power fluctuations.
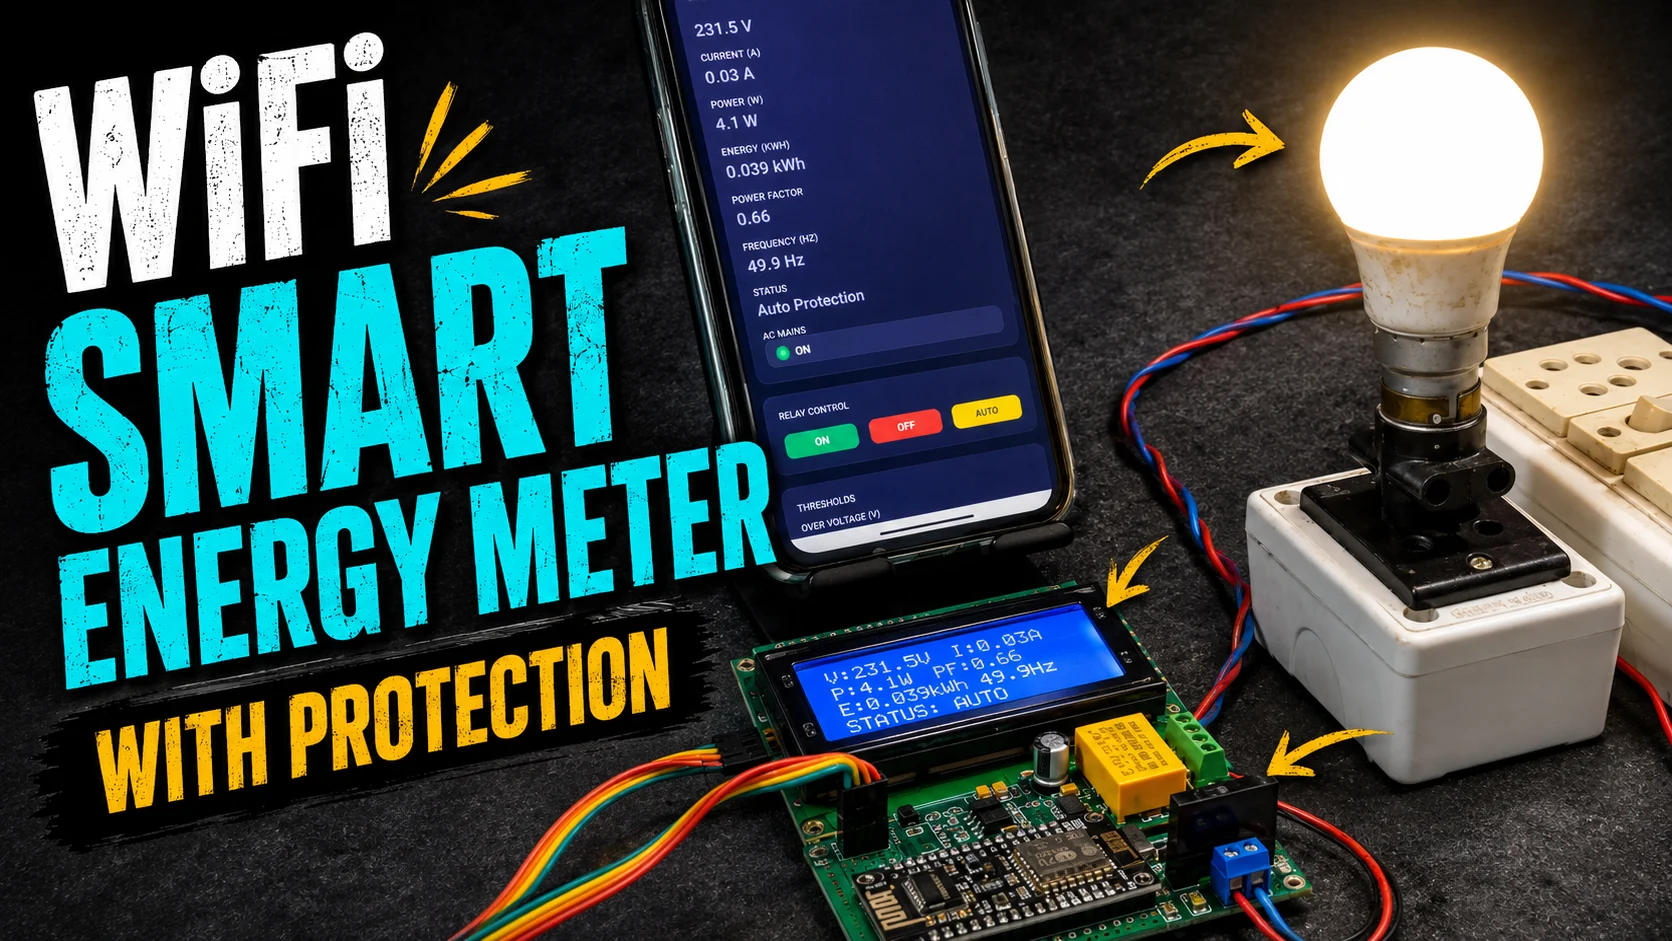
In this project, we’ll build an IoT Smart Energy Meter using ESP8266 and PZEM-004T that monitors real-time power parameters on both an LCD display and web dashboard. The system also includes relay-based protection and automation logic, allowing you to control loads remotely while maintaining system safety and efficiency.
Features of This Smart Energy Meter
- ⚡ Real-time monitoring — Live voltage, current, power, and energy readings from the PZEM-004T for accurate on-device and web updates.
- 📉 Power factor tracking — Displays PF continuously to assess load efficiency and detect poor power quality conditions early.
- 🛡️ Automatic protection — Auto disconnection on over-voltage, under-voltage, and over-current with safe reconnection when parameters normalize.
- 💡 Manual control — One-tap ON/OFF load control directly from the Web UI for instant overrides when needed.
- 💾 Persistent thresholds — User-set OV/UV/OC limits saved in EEPROM so settings survive power loss and reboots.
- 📺 LCD toggle button — Hardware button to switch LCD pages between V/I and P/E/PF views for quick, local status checks.
- 🌐 Wi‑Fi dashboard — Mobile/PC browser access on the same network to view metrics and control the relay without additional apps.
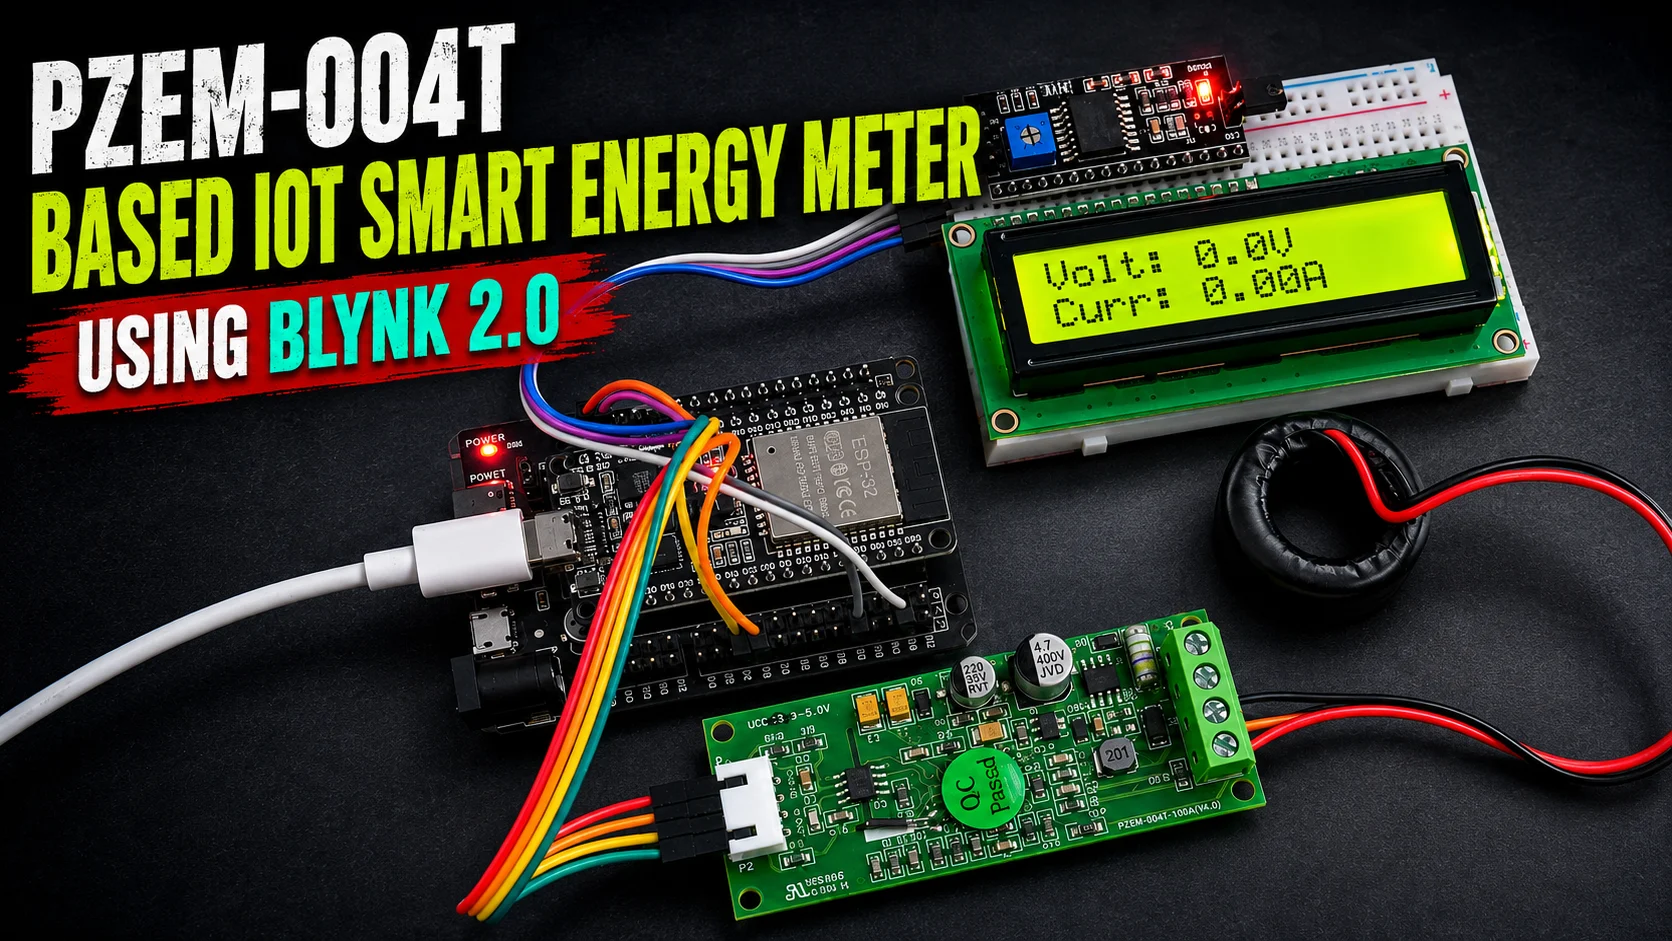
You may check out our another article IoT AC Energy Meter using PZEM-004T & ESP32 Web Server

Circuit Diagram & Connections

Components Required
- ESP8266 NodeMCU [https://amzn.to/4aiU1jF]
- PZEM-004T v3.0 [https://amzn.to/3RFt97i]
- 20×4 I2C LCD [https://amzn.to/4o4F4Yb]
- 5V Relay Module [https://amzn.to/49DJrUd]
- Push Button [https://amzn.to/4uhmYDX]
- Jumper Wires [https://amzn.to/4dZwENc]
- Power Supply [https://amzn.to/4vnD280]
- DC Jack [https://amzn.to/3SfBeQ8]
- Breadboard [https://amzn.to/3PzTGCo]
ESP8266 ↔ PZEM-004T V3
- PZEM VCC → 5V regulated supply; PZEM GND → common GND with ESP8266; do not power PZEM from 3.3V.
- PZEM TX → ESP8266 RX (use a 3.3V‑safe UART path; many V3 boards with opto-couplers are 5V powered but logic is tolerant through the interface).
- PZEM RX → ESP8266 TX (3.3V is typically adequate via opto input; avoid feeding 5V into ESP pins).
- AC sensing: PZEM L/N to mains for voltage and module power; CT clamps around live conductor only, not neutral. Observe isolation and clearances.
ESP8266 ↔ I2C LCD (LiquidCrystal_I2C 20×4)
- LCD VCC → 5V; LCD GND → System GND; SCL → ESP8266 D1 (GPIO5); SDA → ESP8266 D2 (GPIO4).
- Typical I2C backpack address 0x27; keep I2C leads short and twisted with GND where possible to reduce noise.
ESP8266 ↔ Relay module
- Relay IN → ESP8266 D5 (GPIO14) as per sketch; use a relay board with opto/driver transistor; do not drive coil directly from ESP pin.
- Relay VCC → 5V; GND → System GND; use COM/NO to switch the load line; keep mains routing isolated from low‑voltage side.
ESP8266 ↔ Toggle button (LCD page switch)
- One side of push button → ESP8266 D3 (GPIO0) with INPUT_PULLUP in code; other side → GND for active‑LOW press.
- Debounce in firmware and keep short leads to minimize false triggers and EMI pickup near AC lines.
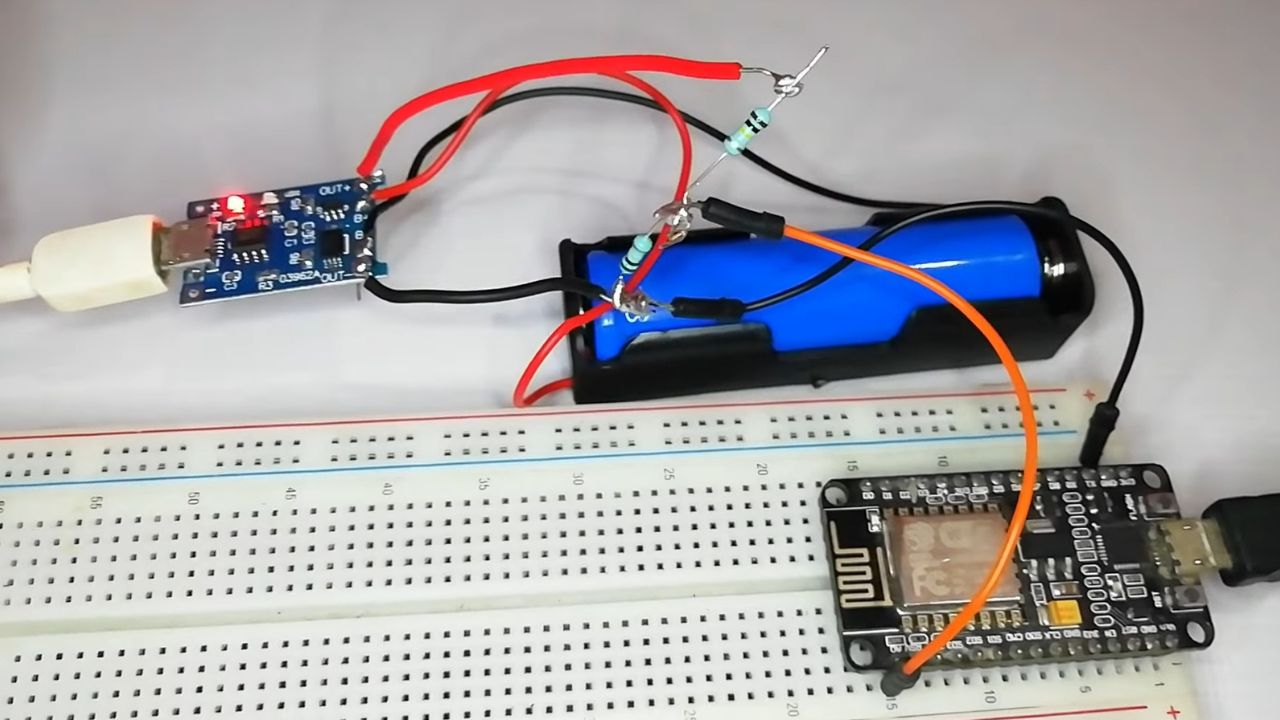
Power and grounding best practices
- Use a dedicated 5V SMPS for PZEM, relay, and LCD; regulate 3.3V for ESP8266 from the same 5V rail; star‑ground to a single common point.
- Maintain safe creepage/clearance between mains and logic, route CT and mains away from I2C/UART, and add fusing on the mains input as appropriate.
Source Code
Video Tutorial
Wi‑Fi setup
- Initializes station mode, connects using SSID and password, and shows status/IP on the LCD for 5 seconds if connected. This gives users immediate feedback and the IP for accessing the web UI.
- HTTP server listens on port 80 and registers routes for root page, readings JSON, relay control, and threshold updates. This follows common ESP8266WebServer patterns for lightweight REST endpoints.
💡 Tip: You can change the Wi‑Fi SSID and password in the user configuration section of the code at the top.
EEPROM for thresholds
- On boot, loads Over Voltage/Under Voltage/Over Current thresholds with EEPROM.get into floats and validates them; if invalid or zero, defaults are restored to 250 V, 180 V, and 32 A. This ensures safe startup behavior.
- When thresholds are changed from the web UI, values are written using EEPROM.put and committed so settings persist across resets.
💡 Tip: Group these three floats into a struct and write once to reduce wear and simplify addressing.
Web server and HTML UI
- Serves a responsive, single‑page UI from PROGMEM with clean cards for metrics and controls; JavaScript polls /readings every 1 s and updates text values. This minimizes bandwidth and keeps UX snappy.
- Endpoints: “/readings” returns JSON, “/relay” accepts manual or auto mode, and “/setThresholds” saves new limits. Using simple GET params keeps the client code minimal.
💡 Tip: If you later add authentication, wrap handlers to check a token or simple password before applying state changes.
PZEM data reading
- Every 1 s, reads voltage, current, power, energy, and power factor via PZEM004Tv30 API; negative or out‑of‑range values are converted to NaN or ignored for stability. This prevents flicker and bad states on sensor hiccups.
- Functions used typically include pzem.voltage(), pzem.current(), pzem.power(), pzem.energy(), and pzem.pf(), aligning with the official v3.0 library.
💡 Tip: Consider also reading frequency with pzem.frequency() and displaying it on page 1 if needed.
Auto protection logic
- In auto mode, compares live readings to thresholds; if over‑voltage, under‑voltage, or over‑current is detected, it opens the relay and latches a status string (“Over Volt”, “Under Volt”, “Over Current”). This provides clear cause visibility.
- When disconnected, it checks that both voltage and current return to safe bands before reconnecting, preventing rapid chatter and protecting appliances.
💡 Tip: Add a minimum off‑time timer (e.g., 5–10 s) before reconnect to avoid nuisance cycling on fluctuating lines.
LCD display switching
- Uses a button on GPIO0 with INPUT_PULLUP; short press toggles pages between V/I + status and P/E/PF. Debounce logic with a 300 ms window avoids accidental multiple toggles.
- Avoids flicker by caching last displayed values and only refreshing when something changes or the page changes. This keeps the 20×4 display readable.
💡 Tip: If an I2C address scan shows a different LCD address than 0x27, update the constructor accordingly.
Relay control
- Drives a relay board from GPIO16 (D0); manual mode forces ON/OFF via the “/relay?state=” endpoint and updates status text, while auto mode clears manual override. Use a proper driver/transistor relay module.
- The JSON reports both measurements and the current protection status, giving the web UI everything needed for live state and threshold display.
💡 Tip: Prefer a low‑active relay module and ensure the default boot state is safe; consider adding a small RC snubber across AC contacts if controlling inductive loads.
Web Interface UI
Smart IoT Energy Meter
Real-time updates
- The dashboard auto-refreshes about every second to show live voltage, current, power, energy, power factor, frequency and a readable status message, so users always see up-to-date measurements without manual reloads.
- Values are formatted in human-friendly units (V, A, W, kWh, Hz) and render in a lightweight card layout, making the IoT Web Dashboard responsive on both mobile and desktop.
Relay buttons
- Three controls provide simple load management: Turn ON, Turn OFF, and Enable Auto; ON/OFF forces manual control, while Auto hands control back to protection logic.
- State changes reflect immediately in the status label, ensuring the ESP8266 Smart Meter UI gives clear feedback about whether the relay is engaged or held off by safety rules.
Protection limits
- Editable fields for Over-Voltage, Under-Voltage, and Over-Current let users customize safety thresholds directly from the page; pressing Save persists the values so they survive reboots.
- Present these inputs with concise hints and default ranges suitable for typical single-phase mains to align with user expectations for an IoT Smart Energy Meter dashboard.
Status and diagnostics
- A prominent “Status” field indicates Normal, Manual ON/OFF, or a cause like Over Volt/Under Volt/Over Current, helping users quickly understand why the relay is disconnected.
- Consider adding a tiny footer notice with the device IP and refresh cadence to improve UX for first-time users of the ESP8266 Smart Meter UI.
Auto Protection Logic (Over/Under Voltage & Overcurrent)
What the protection does?
- If Voltage > OV threshold → Load disconnects immediately and status shows “Over Volt.” This prevents exposure to harmful surges that can stress SMPS and motor windings.
- If Voltage < UV threshold → Load disconnects and status shows “Under Volt.” This avoids brown-out conditions that cause overheating and torque loss in inductive loads.
- If Current > OC threshold → Load disconnects and status shows “Over Current.” This helps prevent cable overheating, relay contact damage, and nuisance breaker trips.
- If all parameters return to normal bands → Auto reconnect. The firmware checks that voltage is between UV and OV limits and current is below OC before re-energizing the relay to restore service safely.
How it works in the loop?
- Continuous sensing: Every ~1 second the meter reads voltage, current, power, energy, PF, and frequency rejecting invalid values to avoid false triggers.
- Decision flow: When in Auto mode, the firmware evaluates OV, UV, and OC in that order; on any violation it opens the relay and records a human-readable cause string for the UI and LCD.
- Safe recovery: While disconnected, the firmware keeps monitoring; once voltage and current fall within threshold limits together, it closes the relay and resets the status to “Normal.”
Safety benefits
- Protects appliances from high-voltage spikes and low-voltage brown-outs, extending the lifespan of SMPS, compressors, fans, and lighting.
- Prevents overcurrent damage from short circuits, locked-rotor starts, or overloaded outlets by opening the relay before thermal stress accumulates.
- Enables hands-free recovery after grid fluctuations; automatic reconnection restores power promptly when conditions stabilize, reducing manual intervention.
- Provides clear diagnostics via the web dashboard and LCD (“Over Volt/Under Volt/Over Current/Normal”) so users immediately know why the load is off and when it will safely resume.
Practical tips
- Add a minimum off-time (e.g., 5–10 seconds) before reconnect to reduce chatter during unstable mains.
- Tune thresholds for local supply (e.g., OV ≈ 250 V, UV ≈ 180–190 V for 230 V grids; OC per wiring and relay rating) and store them in EEPROM so they persist after power cycles.
- Keep the relay default state safe on boot; verify your relay board logic (active LOW vs HIGH) and initialize the GPIO accordingly.
Quick pseudo-logic for clarity
- If auto mode:
- If V > OV → disconnect, status = “Over Volt.”
- Else if V < UV → disconnect, status = “Under Volt.”
- Else if I > OC → disconnect, status = “Over Current.”
- Else if disconnected and V within [UV, OV] and I ≤ OC → reconnect, status = “Normal.”
This structure delivers robust protection, clear user feedback, and automated recovery—ideal for an IoT Smart Energy Meter that prioritizes device safety and uptime.
How the Project Works?
Step-by-step flow
- ESP8266 connects to Wi‑Fi
- On boot, the ESP8266 starts in station mode, connects using the configured SSID/password, and displays connection status and IP on the LCD so users can open the dashboard in a browser.
- PZEM‑004T continuously measures parameters
- The PZEM‑004T V3 module streams voltage, current, power, energy, and power factor over UART; the firmware samples roughly every second and sanitizes invalid readings to keep the UI stable.
- Web server sends JSON every second
- An embedded HTTP server serves a lightweight HTML page; JavaScript polls a “/readings” endpoint at a 1 s interval to update V, I, P, kWh, PF, and Status in real time without page reloads.
- LCD displays readings


- A 20×4 I2C LCD shows two pages: Page 0 for Voltage/Current/Status, and Page 1 for Power/Energy/Power Factor, providing local visibility even without a browser.
- Protection logic controls the relay
- In Auto mode, if Voltage > OV, Voltage < UV, or Current > OC, the firmware opens the relay and sets a clear status (“Over Volt/Under Volt/Over Current”); when readings return to safe ranges, it reconnects.
- Users view and control from any device

- From a phone or PC on the same network, users can view live metrics, toggle the relay ON/OFF, switch to Auto, and adjust OV/UV/OC limits; saved thresholds persist across reboots via EEPROM.
Helpful Callouts
- Tip: Change Wi‑Fi SSID/password at the top of the sketch in the user configuration section.
- Tip: Tune OV/UV/OC to local mains and load ratings; values persist thanks to EEPROM saves from the Settings card.
- Tip: If the LCD shows no text, scan or try 0x27/0x3F for the I2C address and ensure SCL/SDA match your board’s pins.
- Tip: For noisy lines, add a minimum off‑time before auto‑reconnect to reduce relay chatter and protect appliances.
Real-World Applications
- Smart home energy management:
- Track real‑time usage per circuit or appliance, set safe thresholds (OV/UV/OC), and automate load control to reduce bills and extend appliance life.
- Load protection in industries:
- Protect motors, SMPS supplies, and test benches from brown‑outs, surges, and overloads with automatic cut‑off and safe auto‑reconnect to minimize downtime.
- IoT‑based billing system prototypes:
- Build prepaid/postpaid concepts with kWh logging, basic tariff logic, and relay enforcement for labs, hostels, and small facilities before moving to certified meters.
- Renewable energy systems:
- Monitor PV inverter output or battery inverters for voltage/current health, identify low PF issues, and auto‑isolate downstream loads during unstable conditions.
- Facility diagnostics and audits:
- Use the live web dashboard to capture peak loads, detect nuisance trips, and gather evidence for wiring upgrades or schedule optimization.
- Educational labs and research:
- Demonstrate IoT dashboards, energy analytics, and protection schemes in coursework; export time‑series data and evaluate threshold strategies under variable loads.
- Backup power and UPS testing:
- Verify voltage recovery and inrush behavior during switchover events; apply minimum off‑time logic to prevent relay chatter and stress on backup systems.
- Smart plug and gateway prototypes:
- Reuse the web server + relay control as a foundation for MQTT/cloud publishing, enabling integration into larger HEMS or building management systems.
Advantages of IoT Smart Energy Meter
Remote monitoring
- View live voltage, current, power, energy, and power factor from any mobile or PC on the same network, enabling instant visibility without manual meter checks.
- Remote relay control (ON/OFF/Auto) lets users manage loads from the web UI, improving convenience and response time during anomalies.
Accurate and automatic control
- Continuous measurement plus threshold-based logic disconnects the load during over-voltage, under-voltage, or over-current, then safely auto‑reconnects when readings normalize.
- Automatic protection reduces human error and ensures consistent enforcement of safe operating limits for appliances and wiring.
Reduced power wastage
- Real-time usage feedback helps identify inefficient devices, idle loads, and abnormal consumption patterns that can be turned off or optimized.
- Scheduled or rules-based control can cut standby losses and prevent prolonged brown-out operation that wastes energy and stresses equipment.
Customizable thresholds
- User-defined OV/UV/OC limits tailored to local mains and load ratings prevent nuisance trips while maintaining strong protection.
- Thresholds saved in non-volatile memory persist across reboots, ensuring stable behavior and minimal reconfiguration effort.
Additional benefits
- Local LCD plus web dashboard provide redundant visibility, aiding diagnostics and faster decision-making.
- Modular design (ESP8266 + PZEM-004T + relay) is low-cost, scalable, and integrates easily with broader home energy or lab test setups.
Future Enhancements
Cloud data logging
- Blynk: Push kWh, V, I, P, PF, F to virtual pins for global access, event notifications, and basic automations; use Blynk Templates for OTA and role-based dashboards.
- Firebase: Stream structured JSON time‑series (minute-level) for charts and historical analytics; add retention policies and cost-aware batching.
- ThingsBoard: Publish via MQTT with device attributes and telemetry; build role-based dashboards and set alarm rules for OV/UV/OC events at the platform layer.
Mobile app dashboard
- Provide a native-like experience with Blynk mobile (fastest path), or a PWA that caches the local UI and adds push notifications via a lightweight cloud function.
- Include quick actions (ON/OFF/Auto), live gauges, and a weekly energy chart; add a “Reasons” panel surfacing last protection events with timestamps for diagnostics.
3‑phase monitoring version
- Use three PZEM modules (one per phase) or a 3‑phase energy IC; time-align sampling and compute total kW, per‑phase kW, and unbalance percentage.
- Add per‑phase OV/UV thresholds and an aggregate protection policy (e.g., disconnect if any phase violates limits or on severe imbalance).
Energy cost calculation
- Multiply kWh by a configurable tariff, supporting tier slabs and time‑of‑use; store tariff profile in EEPROM/cloud and render daily/weekly/monthly cost.
- Show “Estimated bill to date” and “Projected month-end” using rolling averages; export CSV from the web UI for audits.
Engineering tips to implement
- Abstract telemetry: Build a single publish() layer that can target local JSON, MQTT (ThingsBoard), or HTTPS (Firebase) with compile-time flags.
- Add NTP time sync to timestamp records; buffer unsent data in a ring buffer and flush on connectivity restore.
- Introduce minimum off-time and reconnect hysteresis for protection logic; make both configurable from the settings page.
- For 3‑phase: isolate each PZEM’s UART or use an RS‑485 bus with unique addresses; ensure shared ground is safe and follow mains clearance rules.
UI/UX enhancements
- Add a Trends page: 24‑hour sparkline for V/I/P and a bar for daily kWh.
- Add a Settings pane for tariffs, thresholds, minimum off‑time, and data upload toggles (Local‑only, Cloud‑only, Hybrid).
- Provide a one‑click “Export CSV” and a “Reset Energy (kWh)” control with a confirm dialog for lab scenarios.
These upgrades bring anywhere‑access, long‑term analytics, richer protection, and billing insights—turning your meter into a full IoT energy management node.
Project Demo Video
Troubleshooting & Tips
Q1. Why is my PZEM not reading correctly?
1. Check that the module is powered from AC L/N and the CT clamps around the live wire only, not both conductors.
2. Verify UART wiring (TX↔RX) and library version for PZEM‑004T V3; mismatched versions or swapped lines cause NaN/zero readings.
3. Ensure baud rate is 9600 and avoid long/noisy leads near mains; keep a common ground with the ESP8266 on the logic side.
Q2. The relay doesn’t switch.
1. Confirm the correct GPIO mapping (D0/GPIO16 in your sketch) and that the relay board expects an active‑LOW input if used.
2. Use a relay module with transistor/optocoupler driver; the ESP8266 pin must not drive the coil directly.
3. Check 5V supply quality for the relay, and verify that manual mode is enabled when testing ON/OFF.
Q3. Web page loads but values stay “–”.
1. Make sure JavaScript can reach /readings; verify the device IP and that the browser and ESP are on the same network.
2. If the JSON shows null/NaN, recheck PZEM wiring and power; sensor faults propagate as blank UI values.
Q4. Energy (kWh) seems wrong or doesn’t update.
1. Let the system run under a stable load to accumulate visible kWh; short tests may only show small increments.
2. Confirm that pzem.energy() is read regularly and not reset inadvertently; avoid pressing the module’s hardware reset if you want to retain totals.
Q5. Readings fluctuate or look noisy.
1. Shorten UART/I2C cables and keep them away from AC routing; add ferrite beads or twisted pairs for signal leads.
2. Sample every 1s (as in the sketch) and apply display caching to reduce flicker on the LCD and UI.
Q6. LCD shows nothing or random characters.
1. Check the I2C address (often 0x27 or 0x3F) and the SDA/SCL pins (D2/D1 on NodeMCU).
2. Ensure the LCD VCC is 5V, GND is common, and the contrast pot on the I2C backpack is adjusted.
Q7. Auto protection triggers too often.
`. Review threshold values for local mains; start with OV ≈ 250 V, UV ≈ 180–190 V (230 V systems), OC per load/relay rating.
1. Add a minimum off‑time and small hysteresis to avoid chatter during marginal conditions.
Q8. Button doesn’t switch LCD pages.
1. Confirm the button is wired to GPIO0 (D3) with INPUT_PULLUP and to GND for active‑LOW.
2. Check debounce timing (~300 ms) and ensure no floating states; keep the button leads short.
Conclusion
This IoT Smart Energy Meter using ESP8266 and PZEM‑004T delivers a reliable, low‑cost solution for real‑time monitoring and automatic protection, combining live web dashboards, LCD readouts, and relay control with customizable safety thresholds that persist across reboots. It scales from DIY to lab and small facility use, offering clear diagnostics, efficient energy insights, and hands‑free recovery when grid conditions stabilize.


Can we do simulation for this project,if we can which software we can use for simulation.
Check your mail. I have already contacted you.
Hello, I decided to make this circuit. I bought the code and wrote it into the esp8266, but it turned out that there were errors and the compilation was not going well, so I fixed it myself. The LED on the esp8266 blinks about twice a second, and nothing happens on the 1604. Then I disassembled the circuit and processed only the esp8266, supplied power and connected the 1604 LCD, shouldn’t it be displayed on the web?
Contact me at [email protected]
Nice content.I wants to implement this using stm32 and sct sensor. Can you help??