Electricity is one of the most important parts of our daily life. Almost every home, shop, office, workshop, and small electronics lab depends on electrical appliances. But many people do not know how much power their appliances are using, how many units of electricity are consumed, or how much cost is generated during daily use. Because of this, it becomes difficult to control electricity bills and identify high-power devices.
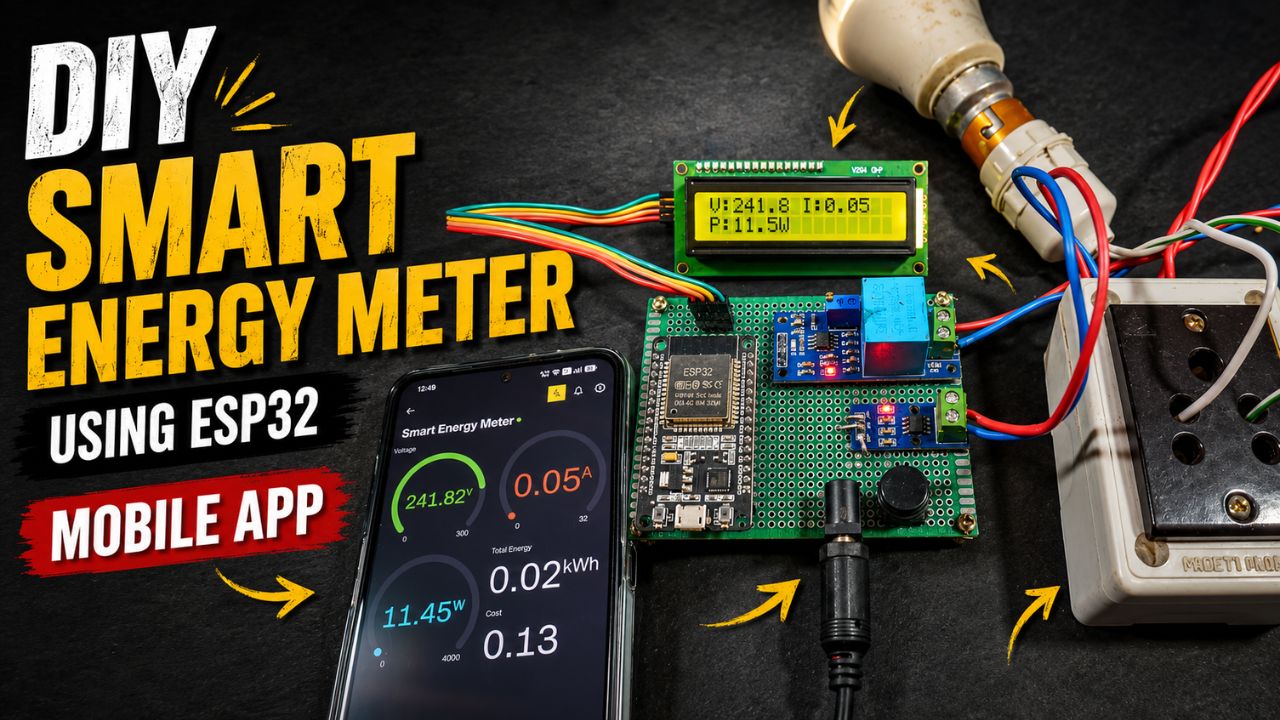
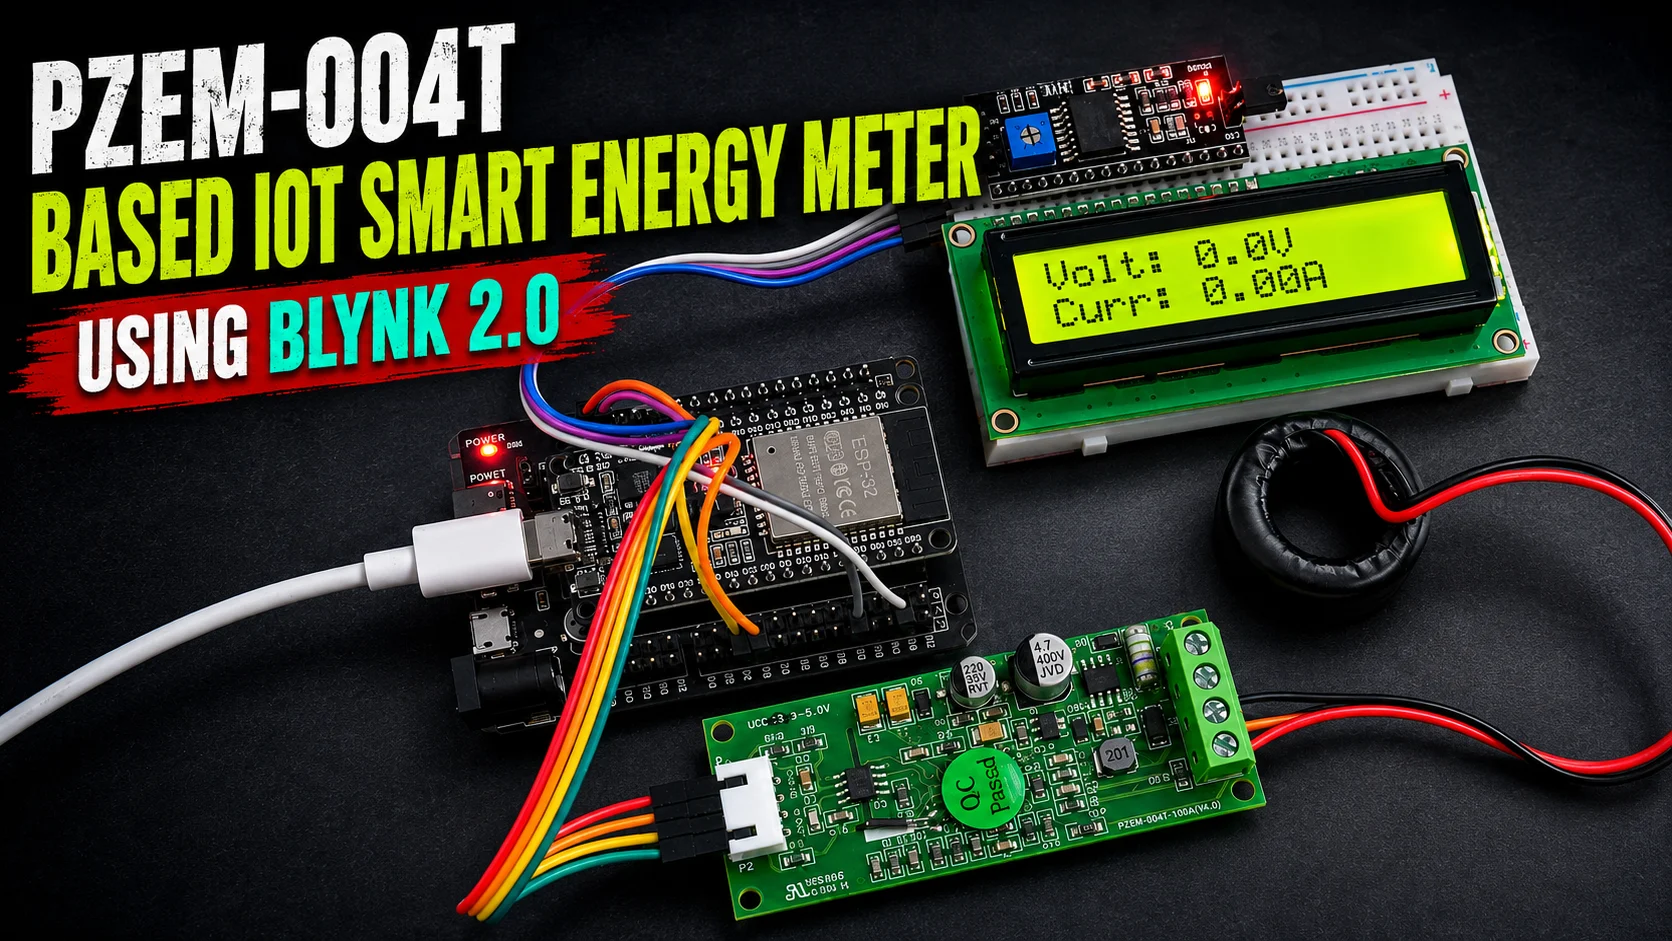
This DIY project solves that problem by using an ESP32 Smart Energy Meter with the PZEM-004T V4.0 energy monitoring module, 16×2 I2C LCD display, and Blynk IoT platform. This project can measure important electrical parameters such as voltage, current, power, total energy unit, frequency, power factor, and total electricity cost. It can also calculate daily energy usage and daily cost, then send the data to Blynk as a notification.
This project is very useful for DIY electronics hobbyists, students, makers, and beginners who want to learn about IoT, energy monitoring, sensor-based projects, and home automation. It is also useful for practical applications such as home energy monitoring, appliance monitoring, small workshop monitoring, smart meter learning, and IoT dashboard-based electricity tracking.
The best part of this project is that it combines both local and remote monitoring. The 16×2 LCD display shows live data directly on the device, while the Blynk IoT dashboard allows you to check the data from your mobile phone. This makes the project more practical and user-friendly.
Project Overview
This project is a complete DIY IoT smart energy meter system based on the ESP32 microcontroller. The ESP32 reads electrical data from the PZEM-004T V4.0 module and processes the values inside the program. After processing, the values are shown on a 16×2 I2C LCD display and also sent to the Blynk IoT cloud dashboard.
The main purpose of this project is to monitor AC electrical parameters in real time. It can show how much voltage is available, how much current is flowing, how much power is being consumed, and how many electricity units are used over time. It also calculates the total cost based on the electricity rate entered in the code.
The project mainly uses:
- ESP32 development board
- PZEM-004T V4.0 energy meter module
- 16×2 I2C LCD display
- Blynk IoT platform
- AC load for testing
- Power supply for ESP32
- Connecting wires and enclosure
In this system, the PZEM module works as the main energy measurement sensor. It measures AC voltage, current, power, energy, frequency, and power factor. The ESP32 works as the brain of the project. It receives the sensor data, calculates energy and cost, updates the LCD screen, stores values, and sends data to the Blynk app.
This project is suitable for people who want to build a low-cost smart energy monitoring system using commonly available electronics components.
Main Features
1. Real-Time Voltage Monitoring
The project can measure AC voltage in real time using the PZEM-004T V4.0 module. Voltage monitoring is important because unstable voltage can affect electrical appliances. If the voltage is too low or too high, sensitive electronics may not work properly.
In this project, the voltage value is displayed on the LCD and also sent to the Blynk dashboard. This allows you to check the voltage locally and remotely.
2. Real-Time Current Monitoring
The PZEM module can also measure the current drawn by the connected load. Current measurement helps you understand how much electrical current an appliance is using.
For example, a small LED bulb will draw very low current, while a heater, iron, motor, or high-power appliance will draw more current. This feature is useful for comparing different appliances and understanding their power usage.
3. Real-Time Power Measurement
Power is one of the most important values in an energy meter. It is usually measured in watts. This project shows the real-time power consumption of the connected load.
Power measurement helps you identify high-load appliances. If a device consumes more power, it will also increase electricity cost. By watching the power value, users can understand which device is consuming more energy.
4. Total Energy Unit Calculation
Electricity billing is usually based on energy consumption in kilowatt-hour, also called unit. One unit means 1 kWh of energy.
This project calculates total energy usage and displays it as units. This is useful because it helps users understand how much electricity has been consumed over time.
5. Frequency Monitoring
The project can display AC frequency. In many countries, the standard AC frequency is 50 Hz or 60 Hz depending on the region. Monitoring frequency is useful for learning and for checking the quality of the AC supply.
6. Power Factor Monitoring
Power factor shows how efficiently electrical power is being used. A power factor close to 1 is better. Some appliances like motors, fans, and inductive loads may have a lower power factor.
By displaying the power factor, this project gives more detailed information about the connected load. This makes the project more advanced than a basic voltage and current meter.
7. Total Cost Calculation
The project can calculate the total electricity cost based on the energy consumed. A fixed rate per kWh is entered in the code. The ESP32 multiplies the total unit value by the rate and shows the total cost.
For example, if the energy rate is ₹8 per unit and the load consumes 2 units, then the total cost will be ₹16. This feature makes the project more practical for real-life use.
8. Daily Energy and Daily Cost Tracking
Along with total energy and total cost, the project can also track daily energy and daily cost. This is very useful for daily monitoring.
Daily energy tracking helps users understand how much electricity is used in one day. Daily cost tracking helps users estimate daily electricity spending.
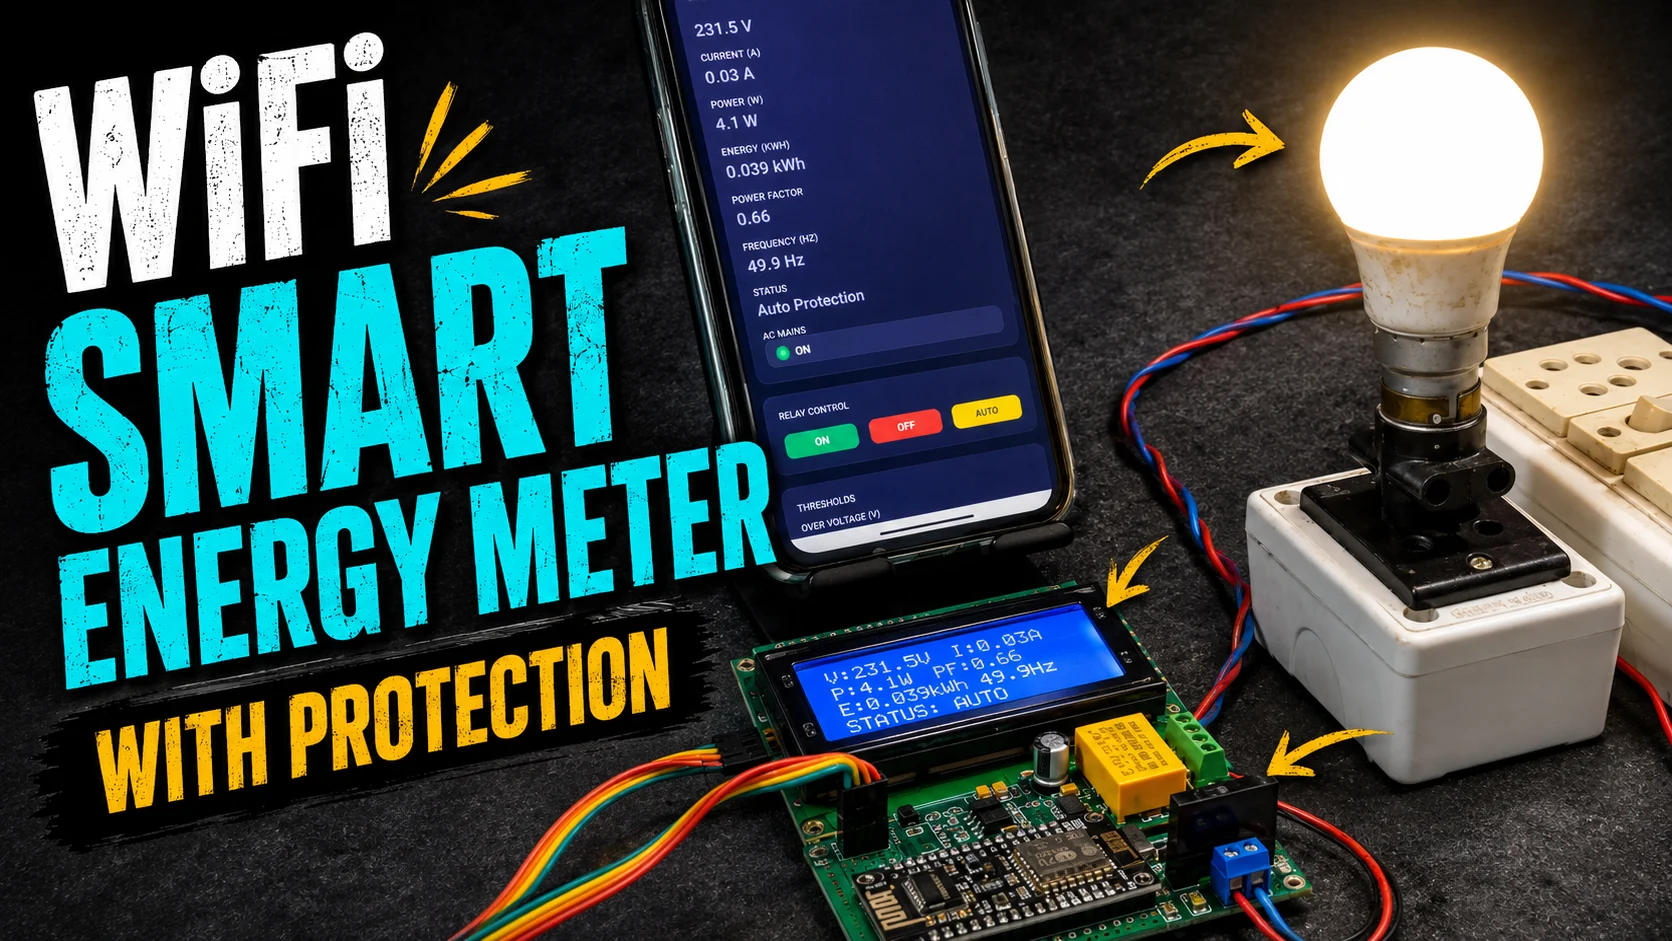
9. Blynk IoT Dashboard
The Blynk IoT platform is used for remote monitoring. The ESP32 sends voltage, current, power, energy, frequency, power factor, and cost data to the Blynk dashboard.
With Blynk, users can monitor the smart energy meter from a mobile phone. This makes the project an IoT project because it connects hardware data to the internet.
10. Blynk Notification
The project can send Blynk notifications for daily energy and daily cost updates. This feature is very helpful because the user does not need to manually check the meter every time.
For example, at the end of the day, the system can send a notification showing daily energy consumed and the daily cost. This makes the project more useful for smart home and energy-saving applications.
11. 16×2 I2C LCD Display
The 16×2 I2C LCD display shows important values directly on the device. This is useful when WiFi is not available or when the user wants to check the reading without opening the mobile app.
The I2C LCD uses only two communication pins, SDA and SCL, which makes wiring simple.
12. EEPROM or Memory Saving
The project can save important energy values so that data is not lost immediately after a restart. This is useful because energy meters should remember the total consumed unit even if the device is turned off.
13. WiFi-Based IoT System
The ESP32 has built-in WiFi, so it can connect directly to the internet without needing an external WiFi module. This makes the project compact and cost-effective.
Components Required
1. ESP32 Development Board

The ESP32 is the main controller of this project. It reads data from the PZEM-004T module, controls the LCD display, calculates energy and cost, and sends data to the Blynk cloud.
ESP32 is used because it has built-in WiFi, good processing power, multiple GPIO pins, and strong support for Arduino IDE.
2. PZEM-004T V4.0 Energy Meter Module

The PZEM-004T V4.0 is the main sensor module used for energy measurement. It can measure AC voltage, current, power, energy, frequency, and power factor.
This module is very useful for DIY energy meter projects because it provides multiple electrical parameters from a single module.
3. Current Transformer or Current Sensor Clamp
The PZEM module usually uses a current transformer clamp to measure AC current. The live wire of the load passes through the CT clamp. The clamp senses the current without directly breaking the wire connection.
This makes current measurement safer and easier compared to direct current sensing.
4. 16×2 I2C LCD Display

The LCD display is used to show values locally. The I2C version of the LCD is better than a normal parallel LCD because it needs fewer wires.

It usually uses four pins:
- VCC
- GND
- SDA
- SCL
5. 5V Power Supply
The ESP32 and LCD need a stable power supply. A good-quality 5V adapter or regulated power supply should be used.
If the power supply is unstable, the ESP32 may restart or show wrong readings.
6. Connecting Wires
Jumper wires or proper insulated wires are required for circuit connections. For AC wiring, use high-quality insulated wire and proper screw terminals.
7. Enclosure Box
An enclosure is highly recommended for safety. Since this project works with AC voltage, all AC connections should be properly covered inside a plastic or insulated box.
8. AC Load for Testing
A test load is required to check the readings. You can use a bulb, fan, charger, small appliance, or any suitable AC load.
For safety, beginners should test with low-power loads first.
Circuit Connection

ESP32 to PZEM-004T V4.0 Connection
The PZEM module communicates with ESP32 using UART serial communication. You can use suitable ESP32 UART pins for RX and TX.
Common connection example:
- PZEM TX to ESP32 D16 (RX2) pin
- PZEM RX to ESP32 D17 (TX2) pin
- PZEM GND to ESP32 GND
- PZEM VCC to suitable power supply, depending on your module version (3.3V or 5V)
Always check the pin marking of your PZEM module before connecting. Wrong wiring may damage the module or ESP32.
ESP32 to 16×2 I2C LCD Connection
The 16×2 I2C LCD uses I2C communication.
Common ESP32 I2C connection:
- LCD VCC to 5V
- LCD GND to ESP32 GND
- LCD SDA to ESP32 GPIO 21
- LCD SCL to ESP32 GPIO 22
Some LCD modules work better with 5V. However, ESP32 logic level is 3.3V. Many I2C LCD modules work fine, but if there is any issue, a logic level shifter can be used.
AC Input and Load Connection
The PZEM module must be connected carefully to the AC line. The voltage input terminals of the PZEM are connected across the AC supply. The CT clamp is placed around the live wire going to the load.
Important points:
- Only one wire should pass through the CT clamp, usually the live wire.
- Do not pass both live and neutral wires through the CT clamp together.
- The AC voltage terminals must be connected properly.
- Use proper insulation and screw terminals.
- Do not touch the circuit when AC power is ON.
Safety Warning
This project works with AC mains voltage, which can be dangerous and may cause electric shock, fire, injury, or death if handled carelessly. If you are a beginner, take help from an experienced electrician or electronics expert.
Always use:
- Proper insulated wires
- Fuse protection
- Enclosure box
- Proper terminal blocks
- No exposed AC contacts
- Separate low-voltage and high-voltage sections
- Safe testing environment
Never touch the circuit while it is connected to AC mains.
Software and Code Explanation
The software part of this project is written for ESP32 using the Arduino IDE. The code controls the complete smart energy meter system.
1. WiFi Connection

The ESP32 connects to a WiFi network using the WiFi credentials provided in the program or saved through the setup method. Once connected, it can communicate with the Blynk IoT cloud.
WiFi is necessary for sending live meter data to Blynk and for receiving remote commands from the dashboard.
2. Blynk IoT Setup

Blynk is used for remote monitoring. In the Blynk dashboard, different widgets can be created for voltage, current, power, energy, frequency, power factor, total cost, daily energy, and daily cost.
The ESP32 sends values to Blynk virtual pins. Each virtual pin can be connected to a Blynk widget.
For example:
- Voltage can be sent to one virtual pin.
- Current can be sent to another virtual pin.
- Power, energy, cost, frequency, and power factor can each use separate virtual pins.
3. PZEM Sensor Reading
The code reads data from the PZEM-004T V4.0 module. The sensor provides values such as:

- Voltage
- Current
- Power
- Energy
- Frequency
- Power factor
The ESP32 reads these values regularly and updates the display and Blynk dashboard.
4. LCD Display Update
The LCD display is used for local monitoring. Since the display is 16×2, it cannot show all values at the same time. So, the program can show values page by page.
Example LCD pages:
Page 1:

- Voltage
- Current
Page 2:

- Power
- Total Energy (Unit)
Page 3:

- Frequency
- Power factor
Page 4:

- Total cost
- AutoPage Status
This makes the display clean and easy to read.
5. Energy and Cost Calculation
The PZEM module can measure energy consumption. The code uses this energy value to calculate electricity cost.
The basic formula is:
Total Cost = Total Energy Unit × Cost Per Unit
For example, if the electricity rate is 8 per unit and the consumed energy is 5 units, then:
Total Cost = 5 × 8 = 40
This simple calculation helps users understand the estimated electricity bill.
6. Daily Energy and Daily Cost
The code can track daily energy usage. At the start of a new day, the system can store the previous energy value and calculate the difference at the end of the day.
Daily Energy = Current Total Energy – Previous Day Energy
Daily Cost = Daily Energy × Cost Per Unit
This daily data can be sent to Blynk as a notification.
7. Blynk Notification
The Blynk notification feature is useful for daily reports. The ESP32 can send a message containing daily energy and daily cost.
Example notification:
Daily Energy: 1.250 kWh
Daily Cost: ₹10.00
This feature is very helpful for users who want to track electricity usage every day without manually checking the meter.
8. EEPROM or Preferences Saving
The code can save energy data in memory. This prevents the value from resetting every time the ESP32 restarts.
This is important because an energy meter should remember previous consumption data.
9. Button Control
A push button can be used to change LCD pages or reset energy data. A short press can change display pages, and a long press can reset the stored energy value.
This makes the device easier to use without needing a mobile app for every small action.
10. Error Handling and Safe Readings
Sometimes sensors may return invalid values due to wiring issues, startup delay, or communication problems. The code should check if a reading is valid before displaying it.
For example, if voltage is not detected, then current, power, frequency, and power factor can be set to zero. This prevents wrong or garbage values from appearing on the LCD and Blynk dashboard.
Step-by-Step DIY Build Process
Step 1: Collect All Components
First, collect all required components:
- ESP32 board
- PZEM-004T V4.0 module
- 16×2 I2C LCD display
- Jumper wires
- Power supply
- AC socket or load connection board
- Enclosure box
- Fuse and terminal connectors
Do not start AC wiring without proper safety preparation.
Step 2: Install Arduino IDE
Install Arduino IDE on your computer. Then add ESP32 board support from the Boards Manager.
After installation, select the correct ESP32 Dev Module board from the Tools menu.
Select correct port.
Step 3: Install Required Libraries
Install the required libraries for the project. Common libraries include:
- Blynk library
- PZEM-004T library
- LiquidCrystal I2C library
These libraries allow the ESP32 to connect to WiFi, communicate with Blynk, read PZEM data, and control the LCD display.
Step 4: Create Blynk Template
Open the Blynk IoT platform and create a new template for the smart energy meter.
Add datastreams for:
- Voltage
- Current
- Power
- Total energy
- Frequency
- Power factor
- Total cost
- Data Reset
Then create a mobile or web dashboard using gauges, labels, charts, and notification events.
Step 5: Enter Blynk Details in Code
Copy the Blynk Template ID, Template Name, and Auth Token from your Blynk account. Paste them into the code.
Make sure the WiFi SSID and password are correct.
Step 6: Connect LCD with ESP32
Connect the 16×2 I2C LCD display to the ESP32. Use the SDA and SCL pins properly.
After uploading a simple LCD test code, check whether the display is working. If the display is blank, adjust the contrast potentiometer on the I2C module.
Step 7: Connect PZEM with ESP32
Connect the PZEM TX and RX pins to the ESP32 UART pins. Make sure TX and RX are crossed correctly.
PZEM TX should go to ESP32 RX2.
PZEM RX should go to ESP32 TX2.
Also connect the GND properly.
Step 8: Upload the Code
Connect ESP32 to your computer using USB cable. Select the correct board and COM port in Arduino IDE. Then upload the code.
After uploading, open the Serial Monitor and check whether the ESP32 is connecting to WiFi and reading data from the PZEM module.
Step 9: Connect AC Load Safely
After confirming the low-voltage side is working, connect the AC side carefully.
Use a test load such as a bulb or small appliance. Place the CT clamp around the live wire only.
Keep all AC connections inside an insulated box or protected terminal area.
Step 10: Test Local Display
Turn on the system and check the LCD display. It should show voltage, current, power, energy, frequency, power factor, and cost values.
If no load is connected, current and power should be close to zero.
Step 11: Test Blynk Dashboard
Open the Blynk app or web dashboard. Check whether all values are updating in real time.
If values are not updating, check:
- WiFi connection
- Blynk Auth Token
- Virtual pin setup
- Internet connection
- ESP32 serial monitor messages
Step 12: Test Daily Notification
Keep the meter running and check whether the daily energy and cost notification is working. You can also test the notification function by reducing the notification time temporarily during testing.
After confirming it works, set it back to the required daily report time.
Testing and Results
Testing is a very important part of this project. Because this project works with AC voltage, testing should be done carefully.
No Load Test
First, power the ESP32 and PZEM module without connecting any load. The voltage should show the AC supply voltage. Current and power should be close to zero.

Expected result:
- Voltage: Around your AC supply voltage
- Current: 0 A or very low
- Power: 0 W or very low
- Energy: No major increase
- Cost: No major increase
Small Load Test
Connect a small load such as a 200 watt bulb or phone charger. Now the current and power values should increase.

Expected result:
- Voltage remains almost stable
- Current increases according to the load
- Power shows the wattage of the load
- Energy slowly increases over time
High Load Test
After successful low-load testing, a higher load can be tested carefully. For example, a heater, iron, or motor can be used if the wiring and PZEM rating support it.
Do not exceed the rating of the PZEM module, CT clamp, wires, socket, or relay.
Blynk Test

Open the Blynk dashboard and verify that all values match the LCD readings. The dashboard should update automatically.
You can add charts in Blynk to observe energy usage over time.
Cost Calculation Test
Check the energy rate entered in the code. Then compare the cost calculation manually.
Example:
Energy = 2.5 kWh
Rate = ₹8 per kWh
Cost = 2.5 × 8 = ₹20
The displayed cost should match this calculation.
Daily Notification Test

At the daily report time, the Blynk notification should show daily energy and cost. This confirms that the IoT notification feature is working properly.
Working Principle
The working principle of this ESP32 smart energy meter is simple but very useful.
First, the AC input is connected to the PZEM-004T V4.0 module according to the correct wiring method. The load is connected through the measurement path, and the current transformer clamp is placed around the live wire of the load.
When the connected appliance starts consuming electricity, the PZEM module measures the electrical parameters. It reads voltage from the AC line and current from the CT clamp. Using these values, it calculates power, energy, frequency, and power factor.
The ESP32 communicates with the PZEM module using serial communication. The PZEM sends the measured values to the ESP32. The ESP32 reads these values one by one and stores them in variables.
After reading the data, the ESP32 processes the values. It calculates the total cost using the energy value and the electricity rate. It also tracks daily energy and daily cost for notification purposes.
Then the ESP32 updates the 16×2 I2C LCD display. Because the LCD has only two rows, the values can be shown on different pages. For example, one page can show voltage and current, another page can show power and unit, and another page can show frequency, power factor, and cost.
At the same time, the ESP32 sends the values to the Blynk IoT platform using WiFi. In the Blynk mobile app or web dashboard, the user can see the live values remotely.
For daily reporting, the ESP32 can send a Blynk notification with daily energy and cost details. This helps the user track electricity usage without manually checking the device.
Applications
This ESP32 smart energy meter project can be used in many practical areas.
- Home Energy Monitoring: You can use this project to monitor electricity consumption at home. It helps you understand how much energy your appliances consume.
- Appliance Power Monitoring: You can connect a single appliance and measure its voltage, current, power, unit consumption, and cost. This is useful for testing fans, lights, chargers, heaters, computers, and other devices.
- DIY Smart Meter Project: This project is a great DIY smart meter system for students and electronics hobbyists. It helps users learn about energy measurement, IoT, sensors, and ESP32 programming.
- IoT Learning Project: Because this project uses Blynk IoT, it is perfect for learning how to send sensor data to a cloud dashboard.
- Electronics Lab Testing: In a small electronics lab or workshop, this meter can be used to monitor the power consumption of tools and test equipment.
- Energy Saving System: By monitoring energy usage regularly, users can identify high-power appliances and reduce unnecessary electricity consumption.
- Student Project: This is a strong project idea for school, college, diploma, or engineering students. It includes hardware, software, sensor interfacing, IoT, display, and real-life application.
- Smart Home Automation: This project can be used as a part of a smart home system. It can be expanded with relay control, overload protection, voltage protection, or web dashboard features.
Advantages
- Low-Cost DIY Design: This project uses commonly available components, so it is affordable and easy to build.
- Beginner-Friendly: The project is suitable for beginners who already have basic knowledge of ESP32 and Arduino IDE.
- Real-Time Monitoring: The system shows live voltage, current, power, energy, frequency, power factor, and cost.
- Local and Remote Display: The LCD gives local readings, while Blynk gives remote monitoring from a mobile phone.
- Useful for Energy Saving: By checking electricity usage, users can reduce unnecessary power consumption and save money.
- IoT-Based System: The project connects a real hardware energy meter to the internet, making it a practical IoT project.
- Daily Notification Feature: The daily energy and cost notification helps users track electricity usage automatically.
- Expandable Project:
The project can be upgraded with:
- Relay control
- Overload protection
- Voltage protection
- Web dashboard
- Data logging
- CSV export
- Telegram notification
- Multiple load monitoring
Limitations and Safety Notes
Although this project is useful, it also has some limitations.
- AC Voltage is Dangerous: The project works with mains AC voltage. Incorrect wiring can be dangerous. Always follow proper safety rules.
- Accuracy Depends on Sensor Quality: The reading accuracy depends on the PZEM module quality, wiring, load type, and calibration. For general DIY use, it is very useful. For official billing, use a certified energy meter.
- WiFi is Required for Blynk: The Blynk dashboard and notification require WiFi and internet. If WiFi is not available, only local LCD readings will work.
- LCD Has Limited Space: The 16×2 LCD can show only limited data at one time. That is why multiple display pages are needed.
- Proper Enclosure is Required: Never keep AC wiring open. Use a proper enclosure box to protect the circuit and user.
- Fuse Protection is Recommended: A fuse should be added to protect the circuit from short circuits or overload conditions.
- Do Not Exceed Ratings: Do not connect loads higher than the rating of the PZEM module, CT clamp, wires, socket, or power connector.
Important Safety Guidelines
- Turn off AC power before wiring.
- Use insulated tools.
- Do not touch the circuit when powered.
- Keep AC and DC sections separate.
- Use proper wire thickness.
- Use a fuse at the input side.
- Mount the circuit inside an enclosure.
- Take help from an experienced person if you are not confident with AC wiring.
Conclusion
This ESP32 Smart Energy Meter with PZEM-004T V4.0, Blynk IoT, and 16×2 I2C LCD is a powerful and practical DIY electronics project. It can measure voltage, current, power, total energy unit, frequency, power factor, and electricity cost. It can also track daily energy and daily cost and send Blynk notifications.
This project is very useful for home energy monitoring, appliance testing, IoT learning, smart home automation, and student projects. It gives both local display and remote monitoring, making it more advanced than a basic energy meter.
For DIY electronics makers, this project is a great way to learn ESP32 programming, PZEM sensor interfacing, LCD display control, Blynk IoT dashboard setup, energy calculation, and real-time monitoring. With proper safety precautions and a good enclosure, this smart energy meter can become a very useful device for understanding and managing electricity consumption.
Overall, this is a practical, educational, and expandable ESP32 IoT project for anyone interested in smart energy monitoring and home automation.