
Disclaimer: This article is sponsored by PCBWay, a leading PCB manufacturing company in China. However, PCBWay did not influence this article’s content, methodology, or conclusions. All opinions and findings expressed here are entirely my thoughts.
In the quest for greater energy efficiency and monitoring, building your own Arduino Power Meter can be a rewarding project. This guide will lead you step-by-step through the design and construction of an energy meter, integrating key components like the SCT013 current sensor, ZMPT101B voltage sensor, an I2C LCD display for real-time monitoring, and implementing a secure voltage protection mechanism. With a sponsorship from PCBWay, we will detail the transition from circuit diagram design in KiCad to the PCB ordering process. Whether you are a hobbyist, a student, or a professional, this comprehensive guide offers practical insights and resources to make your project successful.
Introduction
The Arduino Power Meter project is designed for those who want to take control of their energy consumption while ensuring safe and efficient operation. By incorporating sensors such as the SCT-013 and ZMPT101B, this system not only measures current and voltage accurately but also provides vital protection against voltage anomalies using a 5V relay module. With an I2C LCD display for real-time monitoring, this project is ideal for both educational and practical applications in energy management.
What is an Arduino Power Meter?
An Arduino Power Meter is a microcontroller-based device designed to measure electrical parameters such as voltage, current, and power consumption. The system uses sensors like the SCT013 and ZMPT101B to capture real-time electrical data, which is processed by the Arduino board. With additional features like over/under voltage protection and an I2C LCD display, this energy meter not only monitors energy but also safeguards connected devices from voltage irregularities.
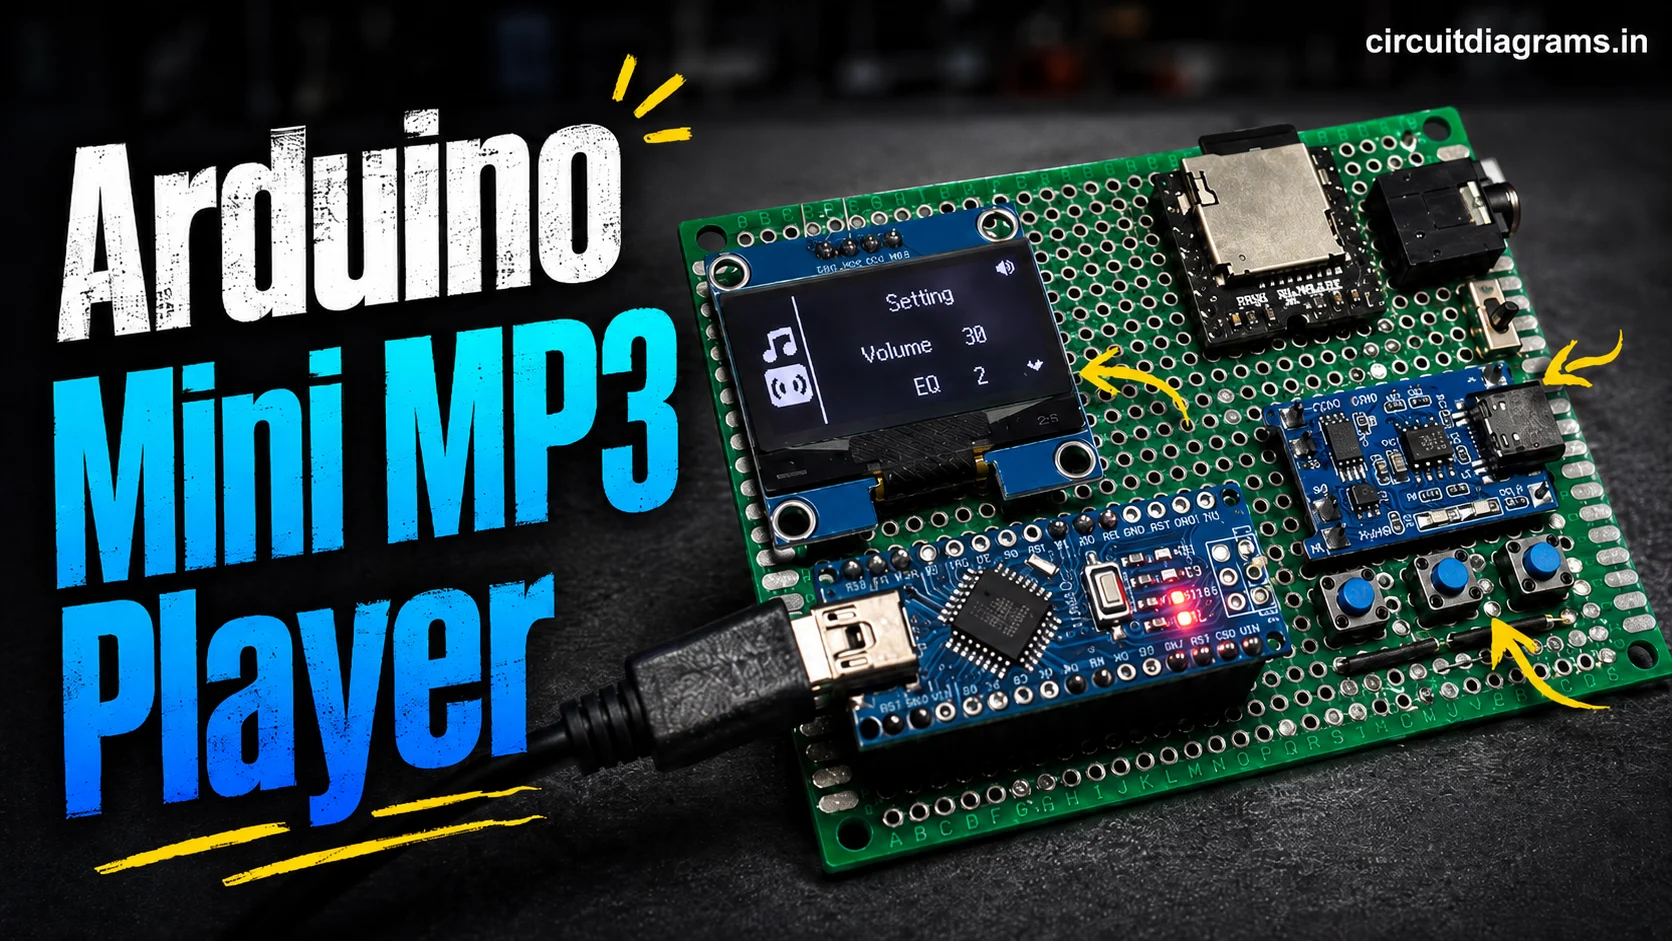
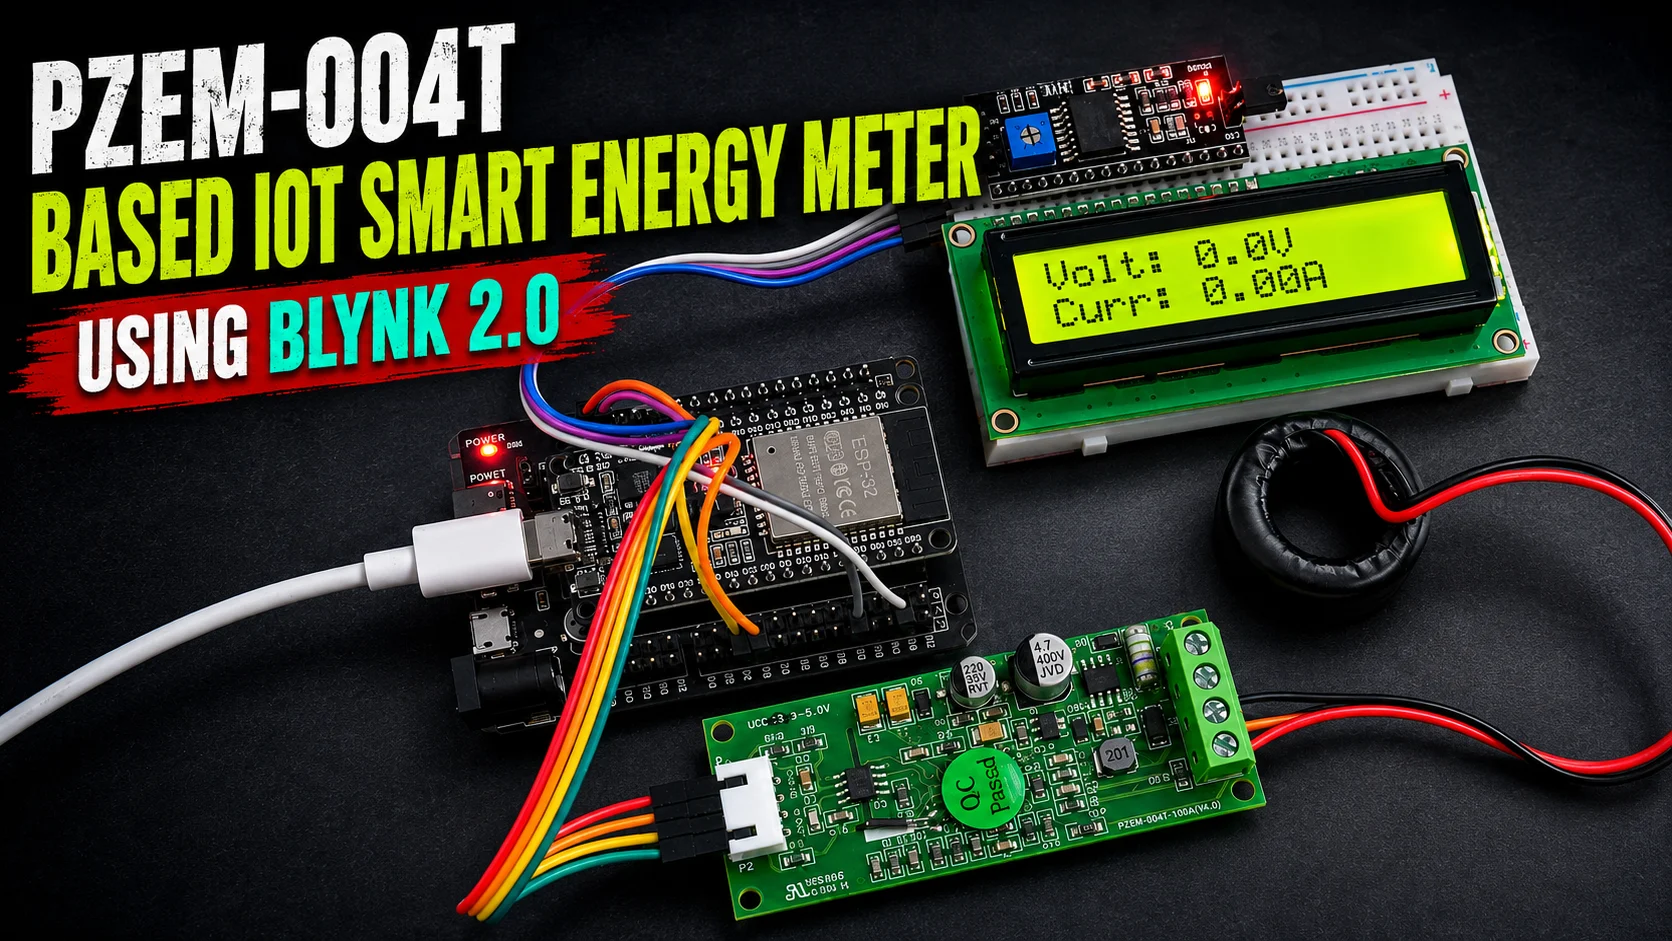
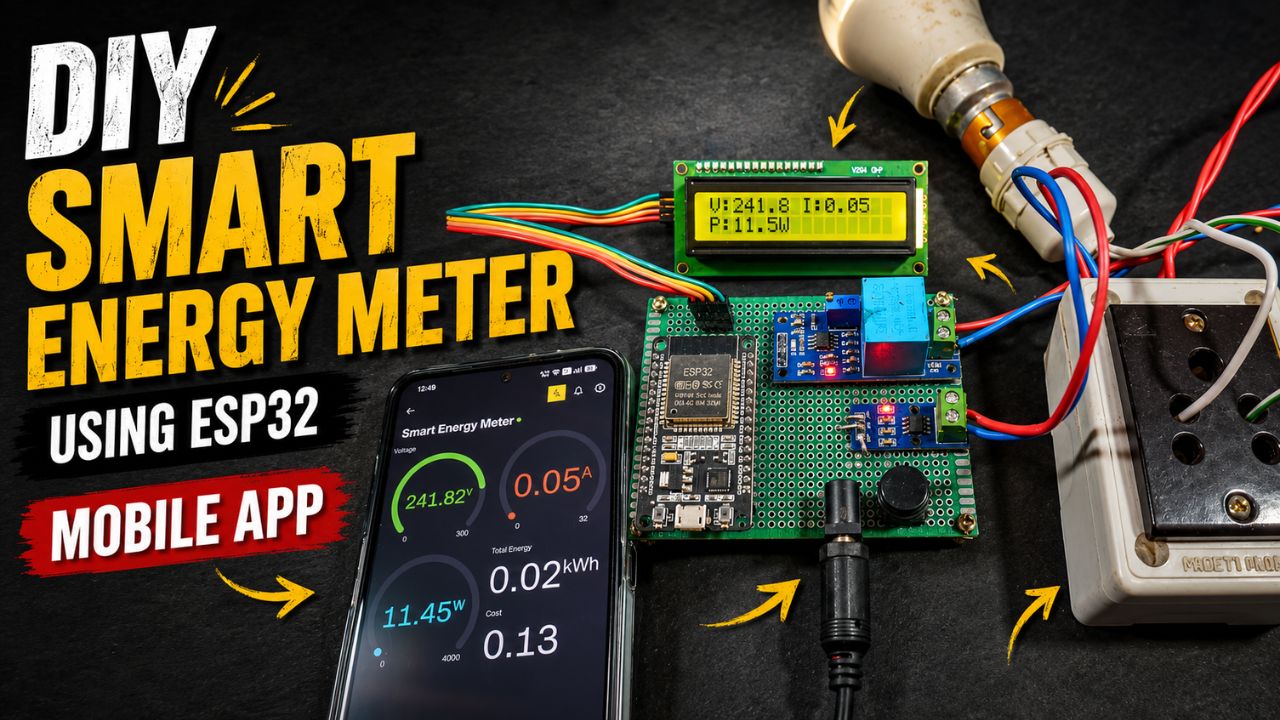
You can also check out our Smart IoT Energy Meter Using ESP32 & Blynk 2.0
Features of This Energy Meter Project
The primary objectives of this project include:
- Accurate Measurement: Utilizes the SCT013 current sensor and ZMPT101B voltage sensor to deliver precise current and voltage readings.
- Real-Time Monitoring: Features an I2C LCD display that continuously shows live energy consumption data.
- Over/Under Voltage Protection: Employs a 5V relay module to safeguard connected devices against voltage fluctuations.
- Customizable and Scalable: Easily modifiable code and sensor calibration allow adaptation for different applications.
- Professional PCB Integration: Designed with KiCad and seamlessly ordered through PCBWay, ensuring high-quality and reliable hardware.
Components Required
To build a reliable Arduino Power Meter, you’ll need the following components:
- Arduino Nano [https://amzn.to/43JiD0X]
- SCT-013 Non-Invasive AC Current Sensor [https://amzn.to/3Ho8y2h]
- ZMPT101B Voltage Sensor [https://amzn.to/4dKUfk8]
- 16×2 I2C LCD Display [https://amzn.to/48osb58]
- 5V Relay Module [https://amzn.to/4jBS7wm]
- Connection Wire
- Breadboard
- +5 Volt Power Supply
Circuit Diagram

Circuit Design Using KiCad
Creating a custom PCB elevates your Arduino Power Meter from a prototype to a professional-grade device. We’ll use KiCad, a free and open-source electronic design automation (EDA) software, to design the circuit schematic and PCB layout.
Step 1: Setting Up Your KiCad Project
- Install KiCad: Download and install KiCad from its official website if you haven’t already.
- Create a New Project: Launch KiCad, click File > New Project, and name it “Arduino_Energy_Meter”.
Step 2: Drawing the Schematic

- Open the Schematic Editor: Select Schematic Layout Editor from the KiCad project window.
- Add Components: Use the Place Symbol tool to add:
- Arduino Nano
- SCT-013 current sensor (represented as a generic CT)
- ZMPT101B voltage sensor module
- I2C LCD display (16×2)
- Resistors (e.g., burden resistor for SCT-013) and capacitors
- Wire the Components:
- Connect the SCT-013 output to Arduino analog pin A0 via the burden resistor.
- Connect the ZMPT101B output to Arduino analog pin A1.
- Wire the I2C LCD’s SDA to A4 and SCL to A5 on the Arduino.
- Add voltage protection between the high-voltage sensors and Arduino inputs.
Step 3: Designing the PCB Layout
- Assign Footprints: In the schematic editor, assign appropriate footprints to each component (e.g., DIP package for Arduino Nano).
- Open PCB Editor: Goto Tools and click on the Update PCB from Schematic option.
- Arrange Components: Position the components logically, keeping high-voltage traces (from sensors) separate from low-voltage Arduino sections.
- Route Traces: Use the Freerouting tool to automatically connect components, ensuring adequate trace width for current capacity and clearance for safety.
Step 4: Finalizing the Design

- Design Rule Check (DRC): Run DRC to verify no errors in spacing or connectivity.
- Add Silkscreen: Label components on the PCB for easy assembly (e.g., “SCT-013,” “Arduino”).
- Export Gerber Files: Go to Fabrication Outputs > Plot and export Gerber files, including drill files, for manufacturing.
This KiCad design process ensures your Arduino Power Meter is both functional and safe, ready for production.
Ordering Your Custom PCB from PCBWay
To bring your Arduino Power Meter to life, partner with PCBWay, a leading PCB manufacturer renowned for its quality, affordability, and fast delivery. Here’s how to order your PCB:
- Visit PCBWay’s Website: Navigate to PCBWay.com and sign up or log in.
- Upload Gerber Files: Click Quote & Order Now, then upload the Gerber files exported from KiCad.
- Specify PCB Details:
- Board Type: Single PCB
- Layers: 2 (for simplicity and cost)
- Dimensions: Based on your KiCad layout
- Thickness: 1.6mm (standard)
- Copper Weight: 1 oz
- Surface Finish: HASL (cost-effective) or ENIG (premium)
- Solder Mask Color: Green (or your preference)
- Review and Order: Check the instant quote, adjust quantities (e.g., 5 or 10 boards), and place your order. PCBWay’s intuitive interface and competitive pricing make it ideal for hobbyists and professionals alike.
- Shipping: Select your preferred shipping method; PCBWay offers fast turnaround, often delivering within days.
Top Products Offered by PCBWay
While PCBWay is renowned for its PCB prototyping services, it also offers several advanced solutions that make it a one-stop platform for electronics manufacturing. Here are the top services that make PCBWay a trusted partner for makers and professionals alike:
1. PCB Fabrication

PCBWay delivers high-quality, low-cost PCB fabrication for both prototypes and mass production. Whether you’re designing a simple single-layer board or a complex multilayer stack-up, they support:
- 1–32 layer boards.
- Rigid, flexible, and rigid-flex PCBs.
- High-frequency and high-TG materials.
- Quick turnaround times with global shipping.
- Ideal for hobbyists, students, and professional engineers.
2. PCB Assembly (PCBA)

With their turnkey PCB Assembly services, PCBWay handles everything from sourcing components to assembling your boards. They offer:
- SMT, THT, and mixed assembly.
- Component sourcing from trusted distributors.
- Functional testing and quality checks (AOI, X-Ray).
- Fast prototyping and production-scale assembly.
This is a great solution for anyone looking to skip manual soldering and receive ready-to-use boards.
3. 3D Printing Services

For rapid prototyping of mechanical enclosures or parts, PCBWay’s 3D printing service supports:
- Multiple technologies: FDM, SLA, SLS, MJF, DMLS, Polyjet.
- Wide material choices: PLA, ABS, Nylon, TPU, resin, and more.
- High-precision builds with smooth surface finish.
Perfect for creating enclosures for projects like an Arduino Power Meter or IoT devices.
4. CNC Machining Services

PCBWay offers custom CNC machining for precise metal and plastic components, including:
- Milling, turning, and engraving.
- Tight tolerances (±0.01mm).
- Material support: Aluminum, Steel, Brass, POM, etc.
- Surface finishes: Anodizing, powder coating, polishing.
Ideal for making heat sinks, brackets, and custom mechanical parts.
Thanks to PCBWay’s sponsorship, this project benefits from their high-quality PCBs, ensuring your Arduino Power Meter is durable and reliable. Their excellent customer support and community engagement further enhance the experience, making them a top choice for custom electronics projects.
Source Code for Arduino Power Meter
/**
 * @file Smart_Power_Meter_Prod.ino
 * @brief Commercial-grade AC Power Monitor with Over/Under Voltage Protection
 * @author Tanmoy Kundu / Circuit Diagrams
 * @version 1.0.0
 *
 * FEATURES:
 * - Non-blocking asynchronous task execution (No delay() used in loop)
 * - Intelligent EEPROM Wear-Leveling (Only saves on significant changes)
 * - Relay chattering prevention via recovery delay timers
 * - Outlier noise filtering for sensor stability
 */

#include <EmonLib.h>
#include <Wire.h>
#include <LiquidCrystal_I2C.h>
#include <EEPROM.h>

// ==========================================
// CONFIGURATION & CALIBRATION CONSTANTS
// ==========================================
#define VOLTAGE_CAL_RATIO      215.0   // ZMPT101B calibration coefficient
#define CURRENT_CAL_RATIO      11.0    // SCT-013 calibration coefficient (100Ω Burden)
#define EMON_SAMPLES           20      // Number of half-wavelengths
#define EMON_TIMEOUT           2000    // Timeout in milliseconds

// Protection Thresholds
#define UNDER_VOLTAGE_LIMIT    190.0
#define OVER_VOLTAGE_LIMIT     250.0
#define MAX_CURRENT_LIMIT      10.0
#define RECOVERY_DELAY_MS      5000    // Time to wait before reconnecting after a fault

// Timing Intervals (Non-blocking)
#define INTERVAL_MEASURE       1000    // 1 Second
#define INTERVAL_EEPROM_WRITE  60000   // 1 Minute (Extended to protect EEPROM lifespan)
#define INTERVAL_SCREEN_TOGGLE 3000    // 3 Seconds

// Hardware Pins
#define VOLTAGE_PIN            A0
#define CURRENT_PIN            A1
#define RELAY_PIN              8

// EEPROM Memory Map
#define EEPROM_ADDR_ENERGY     0

// ==========================================
// OBJECT DEFINITIONS & GLOBAL VARIABLES
// ==========================================
LiquidCrystal_I2C lcd(0x27, 16, 2); // Change to (0x27, 20, 4) if using 20x4 display

EnergyMonitor emonVoltage;
EnergyMonitor emonCurrent;

// Async Task Timers
unsigned long prevMeasureTime     = 0;
unsigned long prevEEPROMTime     = 0;
unsigned long prevScreenTime     = 0;
unsigned long faultRecoveryTimer  = 0;

// System States
bool showFirstScreen      = true;
bool isPowerCut           = false;
bool inRecoveryPhase      = false;

// Metrics
float totalEnergy_kWh     = 0.0;
float lastSavedEnergy_kWh = 0.0;
float voltage             = 0.0;
float current             = 0.0;
float realPower           = 0.0;

// ==========================================
// SETUP FUNCTION
// ==========================================
void setup() {
  // Initialize Safety Control Immediately
  pinMode(RELAY_PIN, OUTPUT);
  digitalWrite(RELAY_PIN, HIGH); // Start with Relay OFF (Failsafe Open)

  // Initialize Display
  lcd.init();
  lcd.backlight();

  // Production Welcome Screen
  lcd.setCursor(0, 0);
  lcd.print("  SMART ENERGY  ");
  lcd.setCursor(0, 1);
  lcd.print("   MONITOR v1.0 ");

  // Initialize Hardware Sensors
  emonVoltage.voltage(VOLTAGE_PIN, VOLTAGE_CAL_RATIO, 1.7);
  emonCurrent.current(CURRENT_PIN, CURRENT_CAL_RATIO);

  // Load Retained Data from Non-Volatile Memory
  EEPROM.get(EEPROM_ADDR_ENERGY, totalEnergy_kWh);
  if (isnan(totalEnergy_kWh) || totalEnergy_kWh < 0.0) {
    totalEnergy_kWh = 0.0; // Handle pristine unwritten EEPROM state
  }
  lastSavedEnergy_kWh = totalEnergy_kWh;

  // Sensor Stabilization Loop (Discard initial transient spikes)
  for (int i = 0; i < 10; i++) {
    emonVoltage.calcVI(EMON_SAMPLES, EMON_TIMEOUT);
    emonCurrent.calcVI(EMON_SAMPLES, EMON_TIMEOUT);
  }

  lcd.clear();
  digitalWrite(RELAY_PIN, LOW); // Safe initialization complete, engage load relay
}

// ==========================================
// MAIN RECURSIVE LOOP
// ==========================================
void loop() {
  unsigned long currentTime = millis();

  // 1. DYNAMIC SAMPLING & MEASUREMENT TASK
  if (currentTime - prevMeasureTime >= INTERVAL_MEASURE) {
    // Process Voltage
    emonVoltage.calcVI(EMON_SAMPLES, EMON_TIMEOUT);
    voltage = emonVoltage.Vrms;
    if (voltage < 50.0 || voltage > 320.0) voltage = 0.0; // Filter catastrophic noise out

    // Process Current
    emonCurrent.calcVI(EMON_SAMPLES, EMON_TIMEOUT);
    current = emonCurrent.Irms;
    if (current < 0.05 || current > MAX_CURRENT_LIMIT) current = 0.0; // Noise gate floor at 50mA

    // Calculate Active Power Load
    realPower = voltage * current;

    // Accumulate Watt-Hours mathematically converted to kWh
    float energy_Wh = realPower / 3600.0;
    totalEnergy_kWh += (energy_Wh / 1000.0);

    prevMeasureTime = currentTime;
  }

  // 2. INTELLIGENT PROTECTION LOGIC (Anti-Chatter System)
  if (voltage < UNDER_VOLTAGE_LIMIT || voltage > OVER_VOLTAGE_LIMIT || current > MAX_CURRENT_LIMIT) {
    // Instantaneous Fault Detection
    digitalWrite(RELAY_PIN, HIGH); // Drop Load immediately
    isPowerCut = true;
    inRecoveryPhase = false;
  } else {
    // Grid Voltage is within normal parameters
    if (isPowerCut) {
      if (!inRecoveryPhase) {
        faultRecoveryTimer = currentTime; // Start cool-down qualification period
        inRecoveryPhase = true;
      }

      // Reconnect only if the grid has been stable for the entire duration of the recovery window
      if (currentTime - faultRecoveryTimer >= RECOVERY_DELAY_MS) {
        digitalWrite(RELAY_PIN, LOW); // Re-engage load safe line
        isPowerCut = false;
        inRecoveryPhase = false;
      }
    }
  }

  // 3. SECURE EEPROM WEAR-LEVELING TASK
  if (currentTime - prevEEPROMTime >= INTERVAL_EEPROM_WRITE) {
    // Only perform an expensive write flash operation if data changed by more than 0.01 kWh
    if (abs(totalEnergy_kWh - lastSavedEnergy_kWh) >= 0.01) {
      EEPROM.put(EEPROM_ADDR_ENERGY, totalEnergy_kWh);
      lastSavedEnergy_kWh = totalEnergy_kWh;
    }
    prevEEPROMTime = currentTime;
  }

  // 4. ASYNCHRONOUS DISPLAY MULTIPLEXING SYSTEM
  if (currentTime - prevScreenTime >= INTERVAL_SCREEN_TOGGLE) {
    showFirstScreen = !showFirstScreen;
    prevScreenTime = currentTime;
    lcd.clear();
  }

  // Render Display Content
  renderDisplay();
}

// ==========================================
// GRAPHICAL UI RENDERING ENGINE
// ==========================================
void renderDisplay() {
  if (showFirstScreen) {
    // Dashboard A: Operational Telemetry metrics
    lcd.setCursor(0, 0);
    lcd.print("V: ");
    lcd.print((int)voltage);
    lcd.print("V  I: ");
    lcd.print(current, 2);
    lcd.print("A");

    lcd.setCursor(0, 1);
    lcd.print("Pwr: ");
    lcd.print((int)realPower);
    lcd.print(" W       ");
  } else {
    // Dashboard B: Accumulated Totalizers & Active Relay State
    lcd.setCursor(0, 0);
    lcd.print("Energy:");
    lcd.print(totalEnergy_kWh, 2);
    lcd.print("kWh");

    lcd.setCursor(0, 1);
    lcd.print("SYS STATUS: ");
    if (isPowerCut) {
      lcd.print(inRecoveryPhase ? "RECOV" : "FAULT");
    } else {
      lcd.print("OK   ");
    }
  }
}Working Principle of Current and Voltage Sensor
How SCT-013 current sensor measure current?
The SCT013 is a non-invasive current transformer (CT) sensor that measures AC current without direct contact with the conductor. You simply clamp it around a live wire, and it outputs a small AC voltage proportional to the current flowing through the wire.
It works on the principle of electromagnetic induction. When current passes through the conductor, it induces a current in the sensor’s secondary coil, which is then read by the Arduino via an analog input after passing through a burden resistor.
Calibration Tips for Arduino Power Meter
Use a Known Load: Calibrate your sensor using a known AC load (like a 100W bulb or fan) and compare the Arduino reading with a multimeter.
Set the Correct Burden Resistor: Use a burden resistor value suitable for your SCT013 model. For SCT013-000 (100A/50mA), a 33Ω or 62Ω resistor is commonly used.
Apply a Voltage Offset: Use a voltage divider (2 resistors) to center the signal at 2.5V for the Arduino’s ADC to handle both the positive and negative cycles of AC.
Safety Note for Current Sensing
Even though the SCT013 is non-invasive, it’s still dealing with high-voltage AC wiring. Always:
- Turn off power before clamping the sensor.
- Insulate all open wires and terminals.
- Never connect SCT013 directly to mains—always use a burden resistor and ensure isolation from Arduino circuitry.
How ZMPT101B voltage sensor measure voltage?
The ZMPT101B is an AC voltage sensor module designed to safely measure the mains voltage using an onboard precision voltage transformer and conditioning circuitry. It allows microcontrollers like Arduino to read AC voltage values accurately while maintaining electrical isolation.
Internally, the module steps down high AC voltage (e.g., 220V) to a lower level that can be safely read by the Arduino’s analog input pin. It outputs a waveform proportional to the AC mains, typically centred around 2.5V, which the Arduino can then analyse.
Voltage Scaling
The ZMPT101B outputs a scaled-down analog signal based on the input AC voltage. This signal is sinusoidal and requires analog-to-digital conversion to be useful.
- The output range is typically 0–5V, with 2.5V as the midpoint (no voltage).
- You can use calibration factors in your Arduino code to convert analog readings to actual voltage values.
- Scaling is determined by the internal resistor network and transformer ratio.
- Proper calibration is key to get accurate RMS values from the analog readings.
Accuracy Considerations
To ensure reliable readings with the ZMPT101B sensor, consider the following:
- Calibrate your sensor using a multimeter and known voltage sources.
- Use averaging or RMS calculation in the code to get steady values.
- Avoid long wires to the analog pin; use shielding if needed to reduce noise.
- A high-resolution ADC or external ADC module can improve measurement precision.
- Make sure the Arduino’s analog reference voltage (usually 5V) is stable and regulated.
With proper setup and calibration, the ZMPT101B sensor can provide consistent and safe voltage measurements for your Arduino Power Meter project.
Role of Arduino in Power Monitoring
The Arduino acts as the brain of the power monitoring system, interfacing with the ZMPT101B voltage sensor and SCT013 current sensor to process analog signals and calculate useful power metrics in real time. It continuously reads sensor data, performs mathematical conversions, and displays live readings on an LCD or serial monitor.
Reading Analog Values
The Arduino uses its analog-to-digital converter (ADC) to read the analog signals from the sensors:
- analogRead() captures voltage values from the ZMPT101B and current signals from the SCT013.
- Since both sensors output AC waveforms, the Arduino samples these signals at high frequency.
- A series of readings is taken and processed to calculate RMS (Root Mean Square) values.
Voltage and Current Conversion Formulas
To convert raw analog data into real-world voltage and current values, use calibration factors based on your sensor setup:
float voltage = (sensorValue * calibrationFactorVoltage);
float current = (sensorValue * calibrationFactorCurrent);
- Voltage Formula:
Vrms = (Vpeak / √2) after offset removal and peak detection - Current Formula:
Similar approach with calibration for the SCT013 sensor
Accurate calibration ensures reliable real-time monitoring.
Calculating Real-Time Power (Wattage)
Once you have the RMS values for voltage and current, calculating real-time power is straightforward:
float power = voltageRMS * currentRMS;
- This gives active power (Watts) consumed by the connected load.
- You can also extend the code to calculate energy consumption (Wh or kWh) by integrating power over time.
The Arduino loops this logic continuously, allowing live power data to be displayed and used for triggering protections or alerts.
Displaying Readings on I2C LCD Display
The I2C 16×2 LCD display is used to show real-time voltage, current, and power readings from the Arduino Power Meter. Using the I2C interface reduces the number of wires needed, keeping the circuit clean and compact.
Connecting I2C LCD to Arduino
The I2C LCD Module uses only two communication lines SDA and SCL to interact with the Arduino, leaving other pins free for sensors and modules.
Typical I2C connections:
| LCD Pin | Arduino Nano Pin |
|---|---|
| VCC | 5V |
| GND | GND |
| SDA | A4 |
| SCL | A5 |
Note: Use the LiquidCrystal_I2C library to control the display. You can install it via the Arduino Library Manager.
Sample initialization in code:
#include <Wire.h>
#include <LiquidCrystal_I2C.h>

LiquidCrystal_I2C lcd(0x27, 16, 2); // Adjust address if needed

void setup() {
  lcd.init();
  lcd.backlight();
}Formatting Values for Display
To keep the information readable and relevant, format the measured values clearly before displaying:
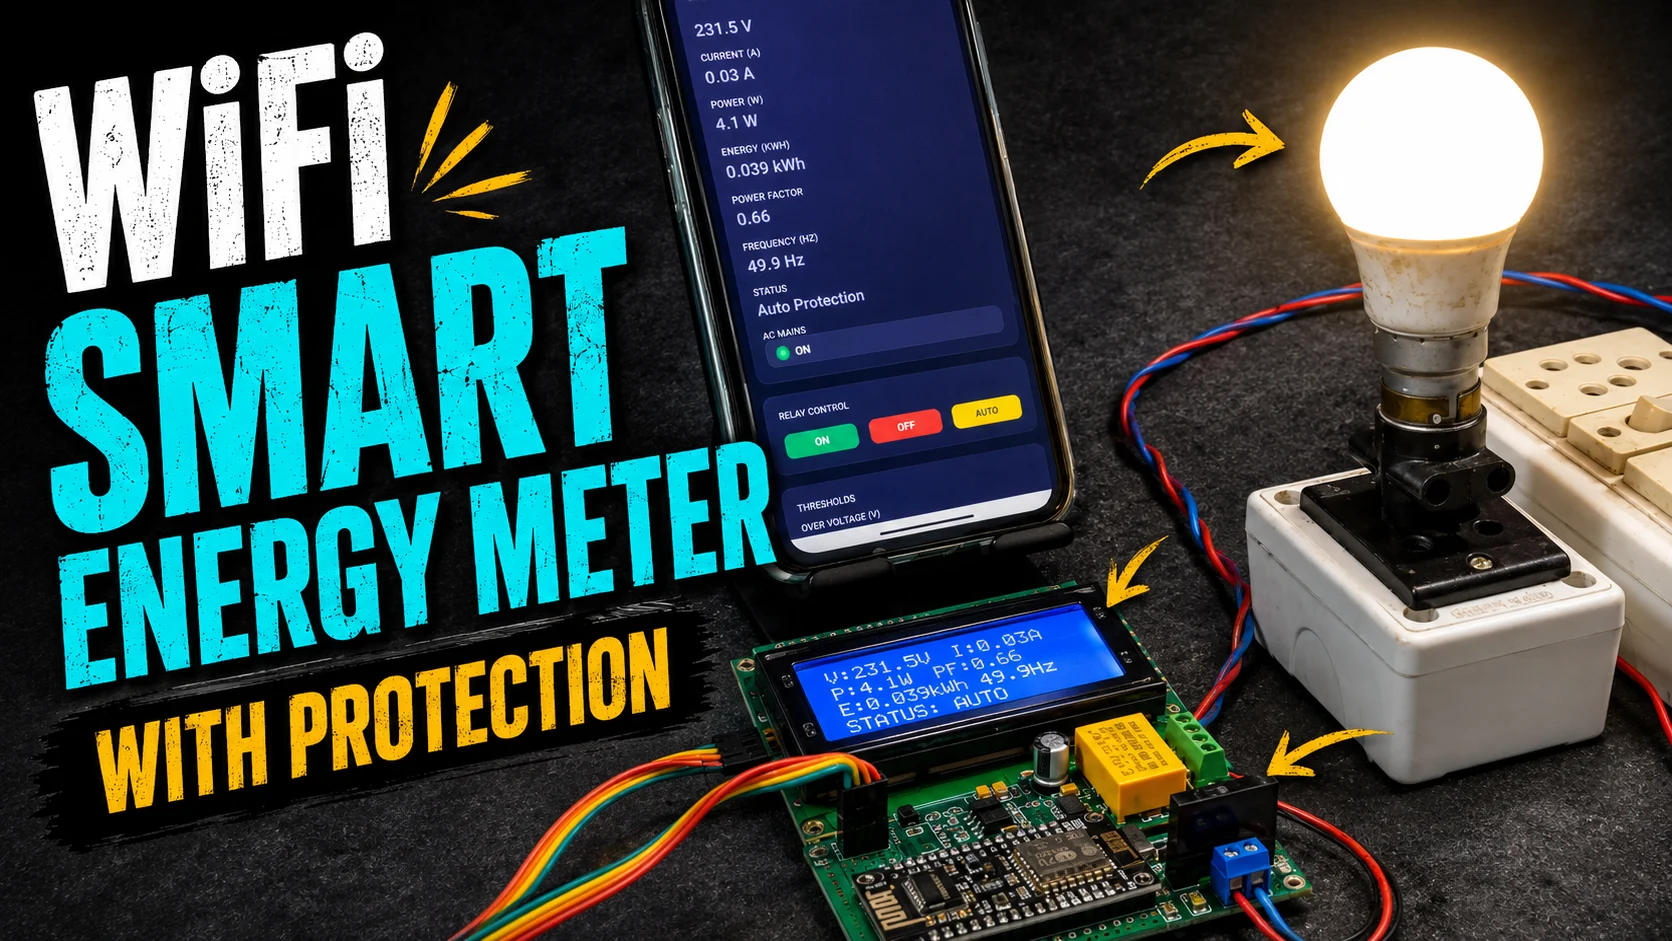
Example output:
V: 229.5V  I: 1.26A
P: 289.2W
Arduino display code:
lcd.setCursor(0, 0);
lcd.print("V:");
lcd.print(voltage, 1);  // 1 decimal place
lcd.print("V I:");
lcd.print(current, 2);  // 2 decimal places

lcd.setCursor(0, 1);
lcd.print("P:");
lcd.print(power, 1);    // Real-time power
lcd.print("W");
You can add conditions to display messages like “Over Voltage!” or “Safe Load” based on threshold logic. Keep the display updated every 500 ms to 1 second for a smooth user experience.
Under and Over Voltage Protection
Implementing under and over voltage protection is vital in preventing damage to your electrical devices. Using a 5V relay module, the system disconnects power automatically when voltage levels deviate beyond safe operating ranges. This section covers the relay-based cutoff logic, how the relay is triggered, and the implementation of voltage threshold logic and optional auto-reset mechanisms.
Relay-Based Voltage Cutoff Logic
The protection mechanism relies on continuously monitoring voltage levels via the ZMPT101B sensor. The Arduino processes these readings and controls a 5V relay. When the voltage exceeds a preset maximum threshold (over-voltage) or drops below a minimum threshold (under-voltage), the relay is activated, disconnecting the power and safeguarding the connected load.
How the 5V Relay Is Triggered?
- Continuous Monitoring: The Arduino reads voltage values at set intervals.
- Condition Check: A conditional statement compares the measured voltage against predefined limits.
- Relay Activation: If the voltage reading is higher than the maximum threshold or lower than the minimum threshold, the Arduino sends a digital signal to trigger the relay. This disconnects the power supply immediately until safe conditions resume.
Voltage Threshold Logic (setPointMin and setPointMax)
- SetPointMin: This is the minimum acceptable voltage level. If the voltage falls below this value, under-voltage protection is activated.
- SetPointMax: This is the maximum acceptable voltage level. When the voltage exceeds this value, over-voltage protection is triggered.
The Arduino uses these thresholds to evaluate the voltage readings:
if (voltage < setPointMin || voltage > setPointMax) {
  digitalWrite(relayPin, HIGH); // Activate relay to disconnect power
} else {
  digitalWrite(relayPin, LOW);  // Keep power connected
}Properly setting these points ensures that the system responds promptly to voltage anomalies, safeguarding devices from electrical stress.
This mechanism ensures that the Arduino Power Meter not only monitors energy consumption accurately but also actively protects connected devices from voltage fluctuations, thereby enhancing the reliability and safety of the overall system.
Video Output
Explanation of Code Sections
The Arduino code for the Power Meter is organized into clear sections that manage sensor calibration, calculate power in real time, update an I2C LCD display, and control voltage protection via a relay. This modular design makes the code easy to maintain and customize.
The Arduino code for the Power Meter is organized into clear sections that manage sensor calibration, calculate power in real time, update an I2C LCD display, and control voltage protection via a relay. This modular design makes the code easy to maintain and customize.
Sensor Calibration
Before calculating real-world voltage and current, the raw analog readings from ZMPT101B and SCT013 need calibration.
Why calibrate?
- Each sensor module may slightly vary.
- The calibration factor converts analog values to accurate voltage and current values.
Sample code:
// --- Calibration Constants ---
float voltageCalibration = 230.0;  // Adjust after testing
float currentCalibration = 60.0; // For SCT-013 100A/50mAUse a multimeter to compare readings and fine-tune these values until your Arduino readings closely match actual measurements.
Real-Time Power Calculation
Once calibrated, voltage and current values are used to calculate RMS values and then multiplied to get real-time power in watts.
// --- Measure Voltage and Current RMS Values ---
float voltageRMS = getVoltage();  // Custom function using ZMPT101B
float currentRMS = getCurrent();  // Custom function using SCT-013

// --- Calculate Power (P = V × I) ---
float power = voltageRMS * currentRMS;You can enhance accuracy by sampling multiple readings over time, applying a moving average, or using zero-cross detection for true RMS.
LCD Display Updates
The I2C LCD is updated every few milliseconds to show real-time voltage, current, and power. Clear formatting and frequent refresh ensure the display is user-friendly.
// --- Display Voltage, Current, and Power on LCD ---
lcd.setCursor(0, 0);
lcd.print("V: ");
lcd.print(voltageRMS, 1);
lcd.print("  I: ");
lcd.print(currentRMS, 2);

lcd.setCursor(0, 1);
lcd.print("P: ");
lcd.print(power, 1);
lcd.print("W");You can also add messages like “Over Voltage” if the protection logic is triggered.
Voltage Protection Relay Control
To protect devices, the Arduino controls a 5V relay based on voltage thresholds.
Set your limits:
Relay control logic:
float setPointMin = 190.0;
float setPointMax = 250.0;// --- Voltage Protection Logic ---
if (voltageRMS < setPointMin || voltageRMS > setPointMax) {
digitalWrite(relayPin, HIGH); // Cut off power
lcd.setCursor(0, 1);
lcd.print("⚠ Voltage Alert!");
}
else {
digitalWrite(relayPin, LOW); // Normal condition
}You may also implement auto-reset after voltage stabilizes for a defined duration.
Final Testing and Troubleshooting


After assembling the circuit and uploading the Arduino code, perform thorough testing to ensure the Arduino Power Meter works as expected. Follow these steps:
Checking LCD Readings
- Verify Sensor Data:
Confirm that the LCD displays accurate, real-time voltage, current, and power values. Compare the readings against a multimeter or known reference device. - Test Consistency:
Observe the display over a few minutes. Stable and consistent readings indicate that sensors are properly calibrated. If readings fluctuate unexpectedly, check connections, grounding, and any potential interference. - Display Messages:
Ensure that the LCD also shows status messages like “Voltage Alert” when parameters exceed set thresholds. Adjust the LiquidCrystal_I2C settings if there are any display issues.
Simulating Under/Over Voltage to Test Relay
- Simulate Voltage Fluctuations:
Use a variable AC power supply or a controlled simulation setup to mimic voltage levels below the minimum threshold (under-voltage) and above the maximum threshold (over-voltage). - Observe Relay Activation:
When voltage deviates from the defined limits (setPointMin and setPointMax), verify that the Arduino signals the 5V relay to switch. The relay should disconnect the power supply, which may be confirmed by an audible click or an LED indicator if available. - Evaluate Auto-Reset (if implemented):
After simulating the voltage anomaly, return the voltage to normal levels to check if the system’s auto-reset logic correctly re-engages the relay after a stable period. Ensure that power is restored without manual intervention. - Safety First:
Always simulate these conditions using safe test setups. Use appropriate protective equipment and isolation transformers if necessary to prevent damage to the components and ensure personal safety.
Applications and Use Cases
- Home Energy Monitoring: The Arduino Power Meter helps monitor home power usage in real-time, letting users track energy-hungry devices and reduce electricity costs effectively.
- Industrial Energy Management: Used in factories or workshops, it monitors machines for power efficiency, detects anomalies early, and helps reduce energy waste in industrial environments.
- Smart Grid and IoT Integration: Integrate it into IoT systems or smart grids to enable remote energy monitoring, automation, and smarter power distribution and control.
- Renewable Energy Systems: In solar or wind setups, the Arduino Power Meter measures energy production and usage, helping optimize renewable power efficiency and storage.
- Educational and DIY Projects: Ideal for students and hobbyists, this project teaches basics of sensors, monitoring, and coding through practical, hands-on learning in electronics.
Frequently Asked Questions (FAQs)
Can I use other microcontrollers?
What happens when voltage goes out of range?
How accurate are SCT013 and ZMPT101B sensors?
Can I log data to the cloud?
Conclusion
The Arduino Power Meter project seamlessly integrates high-precision sensors, such as the SCT-013 and ZMPT101B, with an I2C LCD display to offer real-time monitoring of voltage, current, and power, while safeguarding connected devices through robust under/over voltage protection using a 5V relay. This system enhances safety by automatically disconnecting the load during unsafe voltage conditions and provides a reliable solution for both home and industrial energy management.
Moreover, there is considerable scope for future improvements, including adding WiFi connectivity for remote monitoring, implementing data logging for trend analysis, upgrading display options, and integrating mobile applications to further streamline user experience and enhance overall functionality.


This is 30A/1V SCT sensor. Yes it will work same for your 100A/1V sensor as it is a voltage basaed CT.
is this using 100/50mA or 100/1V ?? if iam use 100A/1V will the result is work with same circuit?
Great project! Loved how you explained the Arduino power meter using SCT013 and ZMPT101B. The under/over voltage protection and LCD display make it super practical. Looking forward to more such informative content!